
Effect of nitrogen application on yield stability of maize||soybean intercropping system
-
摘要:
间作可提升作物产量及产量稳定性, 但对于施氮影响玉米||大豆间作产量稳定性的研究甚少。本研究于2018—2021年在甘肃张掖开展田间试验, 设置2个施氮量(0和300 kg·hm−2, 分别记作N0和N300)和3种种植方式[玉米||大豆间作(M||S)、单作大豆(MS)和单作玉米(MM)]。通过测定单间作条件下作物产量, 核算两个施氮量下单间作体系生产力、土地当量比(LER)、偏土地当量比(pLER)、间作作物超产率(OY)、单间作体系及作物产量稳定性(YS)和单间作体系氮肥农学利用效率(NAE), 并对比分析单间作条件下这些指标的差异, 以明确施氮对玉米||大豆间作体系产量及产量稳定性的影响。主要研究结果如下: 就4年平均水平来看, 相比单作, N0和N300处理下LER值分别为1.26和1.17, 均大于1, 表明M||S体系具有间作产量优势, 且施氮降低了间作产量优势; N0和 N300处理下, 玉米偏土地当量比(pLERm)值分别为0.68和0.82, N0处理大豆偏土地当量比(pLERs)为0.57, N300处理为0.35; N0和N300处理下, 间作玉米超产率分别为36.88%和64.82%, 间作大豆超产率分别为14.77%和−30.46%; 施氮可以提高体系产量稳定性, N300处理产量稳定性较N0显著提高112.7% (P<0.05), 单作体系产量稳定性较间作体系显著提高40.1% (P<0.05), 无论单作还是间作, 同一体系内, 施氮对体系产量稳定性无显著影响; 间作种植中, N300处理间作玉米产量稳定性较N0处理显著提高178.6% (P<0.05), 施氮对大豆产量稳定性无显著影响; 单作种植中, N300处理下单作大豆产量稳定性较N0处理显著提高139.3% (P<0.05), 施氮对单作玉米产量稳定性无显著影响; 间作体系氮肥农学利用效率较单作体系显著提高76.7% (P<0.05)。综上, 在甘肃张掖地区玉米||大豆间作体系中, 产量优势的主要贡献者是玉米, 施氮提升了间作玉米产量及产量稳定性, 降低了间作大豆产量, 不影响间作大豆产量稳定性。
Abstract:Intercropping can improve the yield and stability of crops; however, studies on the effects of nitrogen application rate on yield stability are limited. A field experiment was conducted in Zhangye City, Gansu Province, in China, from 2018 to 2021, including two nitrogen application rates (N0: 0 kg·hm−2; N300: 300 kg·hm−2) and three planting patterns [maize||soybean intercropping (M||S), monoculture soybean (MS), and monoculture maize (MM)]. Crop yields in monoculture and intercropping system were determined. The productivity, land equivalent ratio (LER), partial land equivalent ratio (pLER), overyielding (OY), yield stability (YS), and nitrogen agronomy efficiency (NAE) were calculated. These indices were analyzed by comparing the monoculture and intercropping systems to clarify the effect of nitrogen on the yield and yield stability of M||S intercropping. The results showed that average over year, compared to monoculture, average LER value of the M||S intercropping under N0 and N300 was 1.26 and 1.17, respectively, both were above 1, indicating that there was a intercropping advantage for the M||S intercropping, and nitrogen decreased the advantage. Partial land equivalent ratios for maize (pLERm) under N0 and N300 treatments were 0.68 and 0.82, respectively; pLERs under N0 treatment was 0.57, while it was only 0.35 under N300 treatment. Overyielding of intercropped maize under N0 and N300 treatments were 36.88% and 64.82%, respectively, whereas soybean overyielding were 14.77% and −30.46%, respectively. Nitrogen application improved yield stability, and yield stability under N300 treatment increasd by 112.7% compared to that under N0 treatment (P<0.05). However, monoculture system exhibited 40.1% greater yield stability than that of intercropping system (P<0.05). No significant difference was observed between the yield stabilities under different nitrogen treatments in both intercropping and monoculture systems. In intercropping system, the yield stability of maize under N300 treatment was significantly higher (178.6%) than that under N0 treatmetn (P<0.05). Nitrogen had no significant effect on the yield stability of soybean. In monoculture system, the yield stability of soybean under N300 treatment was significantly higher (139.3%) than that under N0 treatment (P<0.05); nitrogen application had no significant effect on the yield stability of maize. The NAE in intercropping system was 76.7% higher than that in monoculture system (P<0.05). In summary, the main contributor to yield advantage was maize in the M||S intercropping system in the Zhangye City of Gansu Province. Nitrogen improved the yield and yield stability of maize in intercropping system, reduced soybean yield in intercropping system, and did not affect soybean yield stability in intercropping system.
-
Keywords:
- maize||soybean intercropping /
- nitrogen /
- overyielding /
- yield stability
-
大豆[Glycine max (L.) Merr.]供需缺口一直以来是困扰我国粮油安全的难题, 而玉米(Zea mays L.)||大豆带状间作种植为解决这一难题提供了新的途径。研究表明, 相比单作, 玉米||大豆间作可提高作物产量, 减少氮肥投入[1-2], 提升资源利用效率, 增加经济收益[3]。自2021年开始, 农业农村部开始在全国各地推广大豆玉米带状复合种植体系, 其可观的产量和经济收益也得到广大农户的普遍认可[4]。
在一定区域, 相对于单作种植, 玉米||大豆间作具有明显的产量优势。如高阳等[5]研究表明, 玉米套作大豆的总产量分别比单作玉米和单作大豆高6%和320%。张晓娜等[6]在四川的研究表明, 玉米||大豆间作的土地当量比可达1.81。施氮是提高玉米||大豆间作体系作物产量的重要措施[7-10]。在玉米||豆科(Fabaceae Lindl.)间作体系中, 玉米通过种间竞争吸收间作豆科种植带中的土壤氮素, 从而促进间作作物氮素高效利用, 促成间作体系产量优势[11-12]。有研究表明, 玉米套作大豆后通过提高间作作物的氮素累积量[13]和改善作物光合作用等方式实现产量优势。玉米||大豆带状间作模式在甘肃张掖地区广泛分布, 然而, 以往研究表明, 该种植模式在张掖地区的产量优势并不明显[14], 玉米和大豆在该区域同期播种, 共生期近120 d, 过长的共生期致使玉米与大豆产生竞争, 造成间作体系中大豆的显著减产。赵建华等[15]发现, 在玉米||大豆间作体系中, 产量优势的主导效应为选择效应, 即高产作物玉米对体系生产力起主要作用。因此, 该区域玉米||大豆间作产量优势和产量稳定性能否长期维持? 氮肥投入对间作体系的产量稳定性有何影响? 针对这些科学问题和实践问题, 本研究通过连续4 a的玉米||大豆带状间作试验, 探究玉米||大豆带状间作的产量稳定性及其对氮肥的响应。研究结果对该区域玉米||大豆带状长期间作的氮肥施用决策具有指导意义。
1. 材料与方法
1.1 试验区概况
试验于2018—2021年在甘肃省农业科学院张掖节水农业试验站开展, 试验站位于甘肃省张掖市城南15 km处(38°56′N, 100°26′E), 海拔1570 m, 平均年日照时数3085 h, 昼夜温差13.00~16.07 ℃, 年平均气温7 ℃, ≥0 ℃积温3388 ℃·d, ≥10 ℃积温2896 ℃·d, 无霜期153 d。0~200 cm土层平均土壤容重1.376 g·cm−3, 年平均蒸发量2075 mm, 年降水量130 mm, 干旱指数10.3; 地下水埋深68~73 m, 地下水位年变幅1.0 m; 土壤质地为沙质壤土, 有机质22.6 g·kg−1, 速效氮128.8 mg·kg−1, 速效磷53.6 mg·kg−1, 速效钾111.0 mg·kg−1, pH值8.33。
1.2 试验设计
试验设置2个施氮量(0 kg·hm−2和300 kg·hm−2, 分别记为N0和N300)和3个种植体系[玉米||大豆带状间作(M||S)、大豆单作(MS)和玉米单作(MM)]。
间作种植行比为4: 2, 即4行大豆和2行玉米, 间作大豆行距30 cm, 株距12 cm; 间作玉米行距20 cm, 株距12 cm; 大豆与玉米种间距离为35 cm, 间作种植带幅180 cm; 单作作物等行距种植, 单作大豆种植行距36 cm, 株距15 cm, 单作玉米行距72 cm, 株距15 cm (图1)。间作大豆和单作大豆种植密度均为18.5万株·hm−2, 间作玉米和单作玉米种植密度均为9.2万株·hm−2。小区内作物南北向种植, 间作小区包括4个间作组合带, 小区面积40.0 m2 (7.25 m × 5.5 m), 小区与小区间隔50 cm宽田埂。试验小区随机区组排列, 重复3次。大豆品种为‘长农15’, 玉米品种为‘先玉335’。大豆和玉米同时播种, 播种时间分别为2018年4月22日、2019年4月15日、2020年4月20日和2021年4月29日, 大豆收获时间分别为2018年8月30日、2019年9月2日、2020年9月5日和2021年9月5日, 玉米收获时间分别为2018年10月5日、2019年10月16日、2020年10月3日和2021年10月5日。
![]() 图 1 大豆和玉米单间作种植示意图Figure 1. Diagram of planting for soybean and maize under monoculture and intercropping systems
图 1 大豆和玉米单间作种植示意图Figure 1. Diagram of planting for soybean and maize under monoculture and intercropping systems肥料用量和磷肥用量分别为300 kg(N)·hm−2和90 kg(P2O5)·hm−2, 播种整地前每小区均匀撒施1/3氮肥和全部磷肥, 用小型旋耕机将肥料旋入地表; 玉米拔节期和吐丝期各追施1/3氮肥, 追肥时, 全部肥料均匀撒施于地表, 随即伴随浇水渗入地表, 灌水方式为漫灌, 单次灌水量1200 m3·hm−2, 试验期间灌水4次。氮肥为尿素(N = 46%), 磷肥为重过磷酸钙(P2O5 = 43%)。
1.3 作物产量确定
大豆和玉米成熟时, 在间作小区内的4个间作带幅中选取中间带幅, 玉米收获2行, 大豆收获4行, 收获籽粒晾干以计算产量, 单作小区中间部位选取计产带, 计产面积同间作。
1.4 数据分析
1.4.1 土地当量比(land equivalent ratio, LER)
土地当量比常用于衡量间作优势, 其意义在于衡量单作获得与间作相同产量所需耕地面积[16]。
$$ \mathrm{L}\mathrm{E}\mathrm{R}={\mathrm{p}\mathrm{L}\mathrm{E}\mathrm{R}}_{\mathrm{s}}+{\mathrm{p}\mathrm{L}\mathrm{E}\mathrm{R}}_{\mathrm{m}}=\frac{{Y}_{is}}{{Y}_{ss}}+\frac{{Y}_{im}}{{Y}_{sm}} $$ (1) 式中: Yis和Yim分别为间作大豆和玉米的产量, Yss和Ysm分别为单作大豆和玉米的产量, pLERs和pLERm分别为大豆和玉米的偏土地当量比(partial land equivalent ratio, pLER)。LER > 1表明间作存在优势, LER = 1表明间作和单作土地利用效率相同, LER < 1表明间作劣势。
1.4.2 超产率(over yielding, OY)
超产率指间作与单作相比产量或生物量增加或降低的程度[17]。
$$ \mathrm{O}\mathrm{Y}=\frac{{Y}_{i}-P\times {Y}_{s}}{P\times {Y}_{s}}\times 100{\text{%}} $$ (2) 式中: Yi为间作作物产量; P为作物在间作体系中的占地比例, 通过种植密度来计算; Ys为单作作物产量。
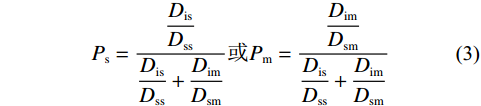
$$ P=\frac{\dfrac{{D}_{i1}}{{D}_{s1}}}{\dfrac{{D}_{i1}}{{D}_{s1}}+\dfrac{{D}_{i2}}{{D}_{s2}}} $$ (3) 式中: Di1和Ds1分别为间作和单作大豆的种植密度, Di2和Ds2分别为间作和单作玉米的种植密度。
经核算, 在本研究中, 大豆和玉米的占地比例均为0.50。OY > 0表示间作作物相对于单作增产, OY = 0 表示间作作物产量与单作作物产量相等, OY < 0表示间作作物相对于单作减产。
1.4.3 单作体系加权产量(weighted mean yield, WMY)
为对比单间作体系生产力, 单作体系产量采用加权平均方法计算[18]。
$$ \mathrm{W}\mathrm{M}\mathrm{Y}={Y}_{ss}\times {P}_{s}+{Y}_{sm}\times {P}_{m} $$ (4) 式中: Yss和Ysm分别为单作大豆和单作玉米的籽粒产量, Ps和Pm分别为大豆和玉米在间作体系中的占地比例。
1.4.4 产量稳定性(yield stability, YS)
产量稳定性可以用来衡量年际变化对种植体系或作物平均产量的变异程度[19], 其值越大, 表明产量稳定性越高。
$$ \mathrm{Y}\mathrm{S}=\frac{\bar{Y}}{\sigma } $$ (5) 式中:
$ \bar{Y} $ 为种植体系或作物年际平均产量,$ \sigma $ 为种植体系或作物年际间产量的标准差。1.4.5 氮肥农学利用率(nitrogen agronomy efficiency, NAE)
氮肥农学利用率可用于表征施氮区单位氮肥所能提供的种植体系或作物生产力[20]。
$$ \mathrm{N}\mathrm{A}\mathrm{E}=\frac{{Y}_{\mathrm{f}}-{Y}_{\mathrm{n}\mathrm{f}}}{N} $$ (6) 式中:
$ {Y}_{\mathrm{f}} $ 为施氮区产量,$ {Y}_{\mathrm{n}\mathrm{f}} $ 为不施氮区产量, N为施氮量。1.4.6 统计分析
采用Microsoft Excel 2019进行数据整理, 采用R 4.4.0软件进行图形绘制和差异显著性分析。以年份和施氮量为因子对作物产量及超产率进行二因素方差分析; 以施氮量和种植体系为因子对产量稳定性进行二因素方差分析; 以种植体系为因子对氮肥农学利用率进行单因素方差分析。
2. 结果与分析
2.1 间作优势
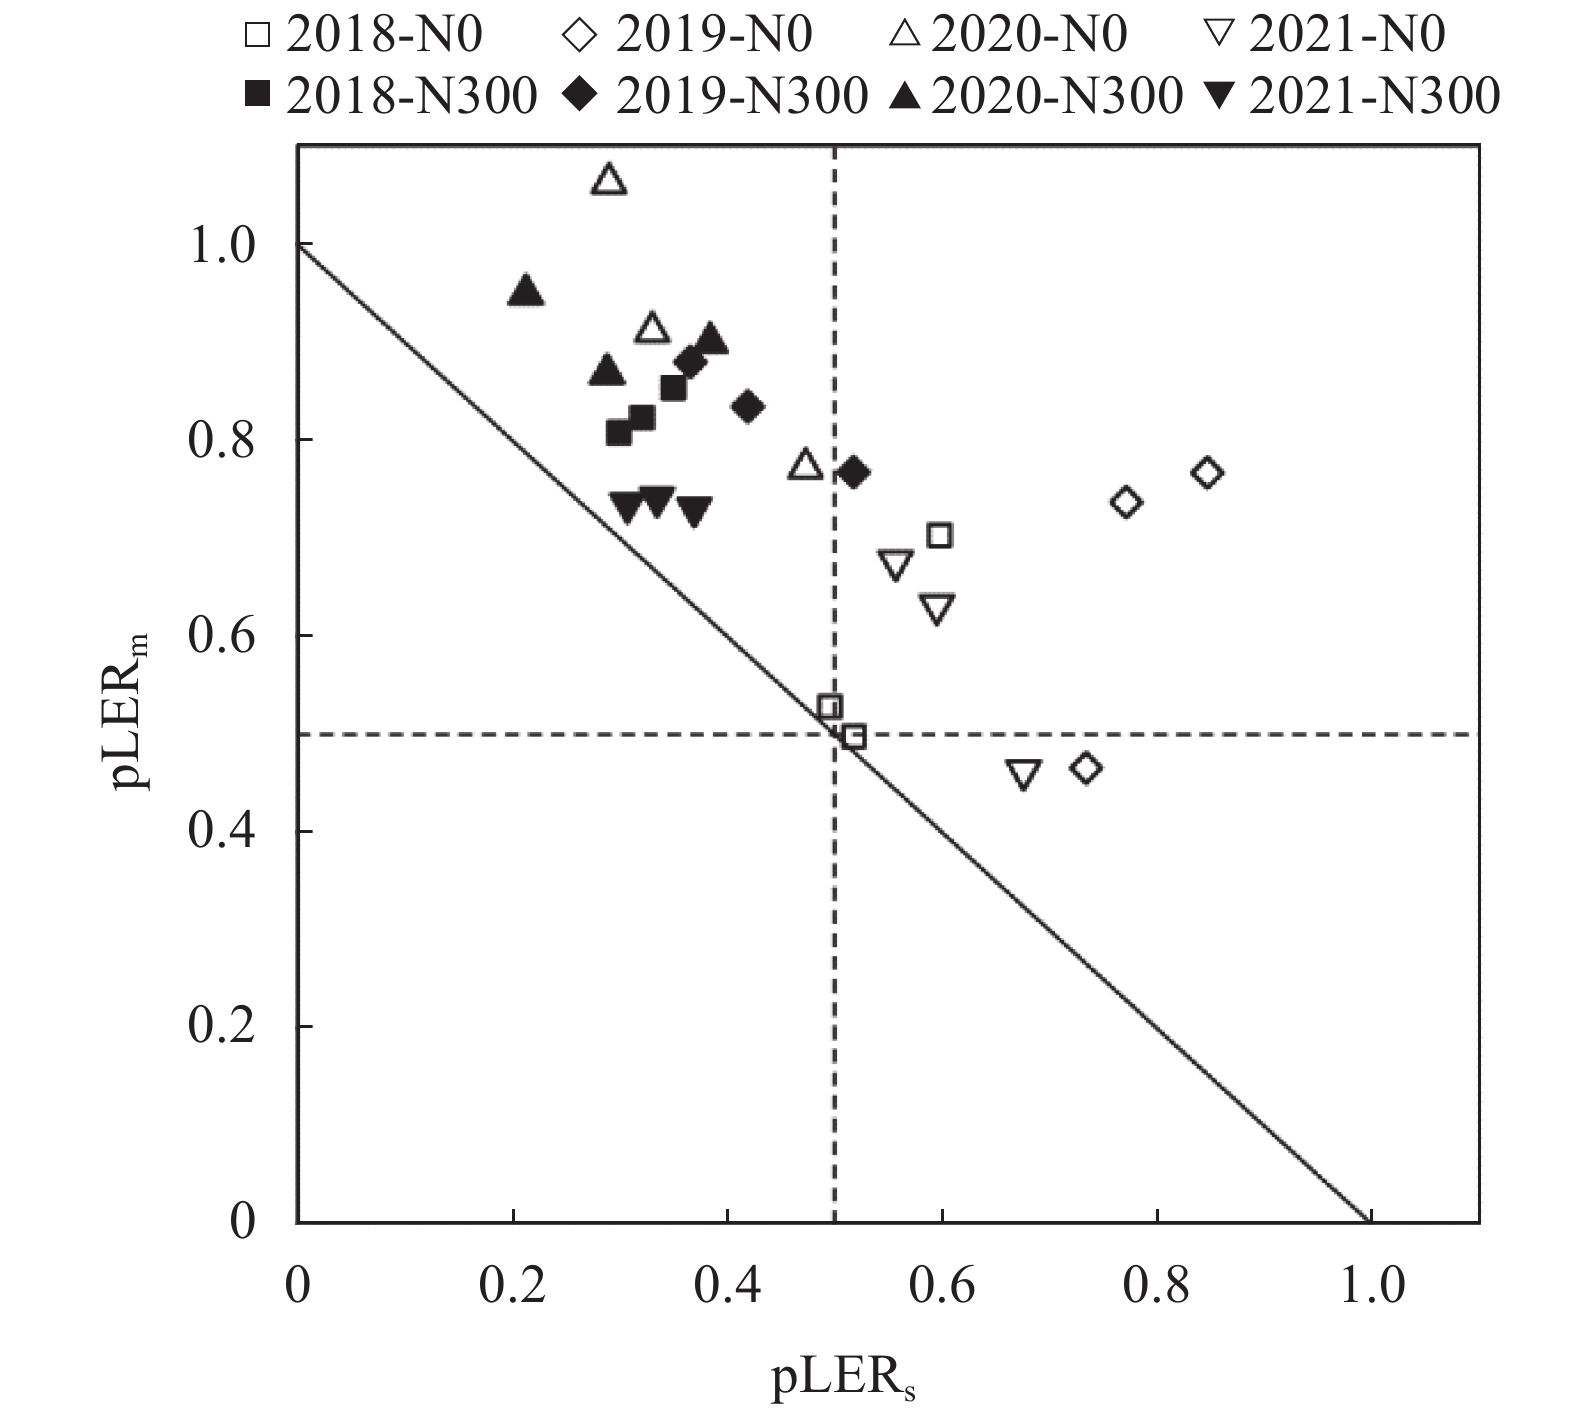
由大豆偏土地当量比(pLERs)和玉米偏土地当量比(pLERm)绘制的散点图(图2)可以看出, 24个点均分布于直线y=x−1的上方, 该直线表示土地当量比(LER)为1。N0处理的LER为1.26, N300处理为1.17。24个点中的22个分布在pLERm为0.5的直线上方, 10个点分布在pLERs为0.5的直线右侧。施氮提高玉米pLERm值, 降低大豆pLERs值, N300处理的pLERm值和pLERs值分别为0.82和0.37, N0处理的pLERm和pLERs值为0.69和0.57。
![]() 图 2 不同氮处理下玉米偏土地当量比与大豆偏土地当量比关系图未填充符号表示N0处理, 实心填充符号表示N300处理。Unfilled symbol refers to N0 treatment, and filled symbol refers to N300 treatment.Figure 2. The relationship between partial land equivalent ratio of maize (pLERm) and partial land equivalent ratio of soybean (pLERs) for the different N treatments
图 2 不同氮处理下玉米偏土地当量比与大豆偏土地当量比关系图未填充符号表示N0处理, 实心填充符号表示N300处理。Unfilled symbol refers to N0 treatment, and filled symbol refers to N300 treatment.Figure 2. The relationship between partial land equivalent ratio of maize (pLERm) and partial land equivalent ratio of soybean (pLERs) for the different N treatments2.2 作物产量
施氮显著增加单间作玉米及单作大豆产量, 但降低间作大豆产量(表1)。N300处理单作大豆产量为3023.9 kg·hm−2, 较N0处理(2494.0 kg·hm−2)显著增加21.3% (P<0.05); N300处理间作大豆产量为1044.0 kg·hm−2, N0处理为1430.5 kg·hm−2, 显著降低27.0% (P<0.05); N300处理单作玉米和间作玉米产量分别较N0处理显著增加87.5% (P<0.05)和126.1% (P<0.05)。
表 1 2018—2021年不同施氮量和不同种植体系下作物产量与超产率Table 1. Yield of crops and overyielding under different nitrogen application rate and cropping systems from 2018 to 2021年份
Year施氮量
Nitrogen application rate大豆产量
Soybean yield (kg·hm−2)玉米产量
Maize yield (kg·hm−2)超产率
Overyielding (%)间作
Intercropping单作
Monoculture间作
Intercropping单作
Monoculture大豆
Soybean玉米
Maize2018 N0 1439.1 ± 171.8a 2690.4 ± 366.8b 5665.9 ± 820.9b 9899.0 ± 818.1b 7.46a 15.25b N300 1011.8 ± 161.8b 3113.8 ± 250.8a 12334.0 ± 1458.1a14882.1 ± 1521.7a−35.28b 65.62a 2019 N0 1713.9 ± 162.4a 1860.4 ± 259.4b 4960.6 ± 492.0b 7798.8 ± 1430.9b 56.81a 31.27b N300 1306.5 ± 50.8b 3055.7 ± 409.4a 14338.4 ± 1377.6a17325.8 ± 875.0a−13.11b 65.42a 2020 N0 1094.3 ± 277.4a 3005.2 ± 45.5b 8026.1 ± 969.3b 8809.8 ± 415.9b −27.06a 82.97a N300 949.5 ± 287.7b 3211.4 ± 133.2a 12899.8 ± 1137.5a14241.3 ± 961.3a−40.92b 81.10a 2021 N0 1474.8 ± 176.1a 2420.2 ± 171.9b 3633.2 ± 950.8b 6094.6 ± 564.9b 21.87a 18.03b N300 908.1 ± 43.4b 2714.8 ± 368.8a 10812.0 ± 399.0a14693.3 ± 486.3a−32.52b 47.16a 均值
Mean valueN0 1430.5 ± 196.9a 2494.0 ± 210.9b 5571.5 ± 808.3b 8150.8 ± 807.4b 14.77a 36.88b N300 1044.0 ± 135.9b 3023.9 ± 285.5a 12596.0 ± 1093.0a15285.6 ± 961.1a−30.46b 64.82a 年份 Year (Y) ns ns ns ** ns ns 施氮量 Nitrogen application rate (N) ** ** ** ** ** ** Y × N ns ns ns ns ns ns 同列数据后不同小写字母表示同一年份不同氮处理间差异显著(P < 0.05)。**表示在P<0.01水平差异显著, ns表示差异不显著。Values in the same column followed by different lowercase letters indicate significant differences among different nitrogen treatments in the same year at P<0.05 level. ** indicates significant differences at P<0.01 level, and ns indicates no significant differences. 施氮显著影响大豆和玉米超产率。从4年平均值来看, N0处理的大豆超产率为14.77%, 而N300为−30.46%; N0和N300处理下的玉米超产率分别为36.88%和64.82%。
2.3 单间作体系产量稳定性
间作体系中, N300处理间作玉米产量稳定性较N0处理显著提高178.6% (P<0.05), 而单作体系中两个施氮量下玉米产量稳定性差异未达显著水平。N300处理下单作大豆产量稳定性较N0处理显著提高139.3% (P<0.05), 而对间作体系中大豆产量稳定无显著影响。无论单间作种植体系, 施氮对体系的产量稳定性均无显著影响(图3A)。
![]() 图 3 种植体系和施氮量对作物及体系产量稳定性的影响同一图内不同小写字母表示差异显著(P<0.05)。Different lowercase letters in the same figure indicate significant differences at P<0.05 level.Figure 3. The effects of cropping systems and nitrogen rates on yield stability of crop and system
图 3 种植体系和施氮量对作物及体系产量稳定性的影响同一图内不同小写字母表示差异显著(P<0.05)。Different lowercase letters in the same figure indicate significant differences at P<0.05 level.Figure 3. The effects of cropping systems and nitrogen rates on yield stability of crop and system分别就主效应种植体系(图3B)和施氮量(图3C)对产量稳定性的影响进行分析发现, 单作体系产量稳定性较间作体系显著提高40.1% (P<0.05), 施氮处理产量稳定性较不施氮提高显著112.7% (P<0.05)。
2.4 氮肥农学利用率
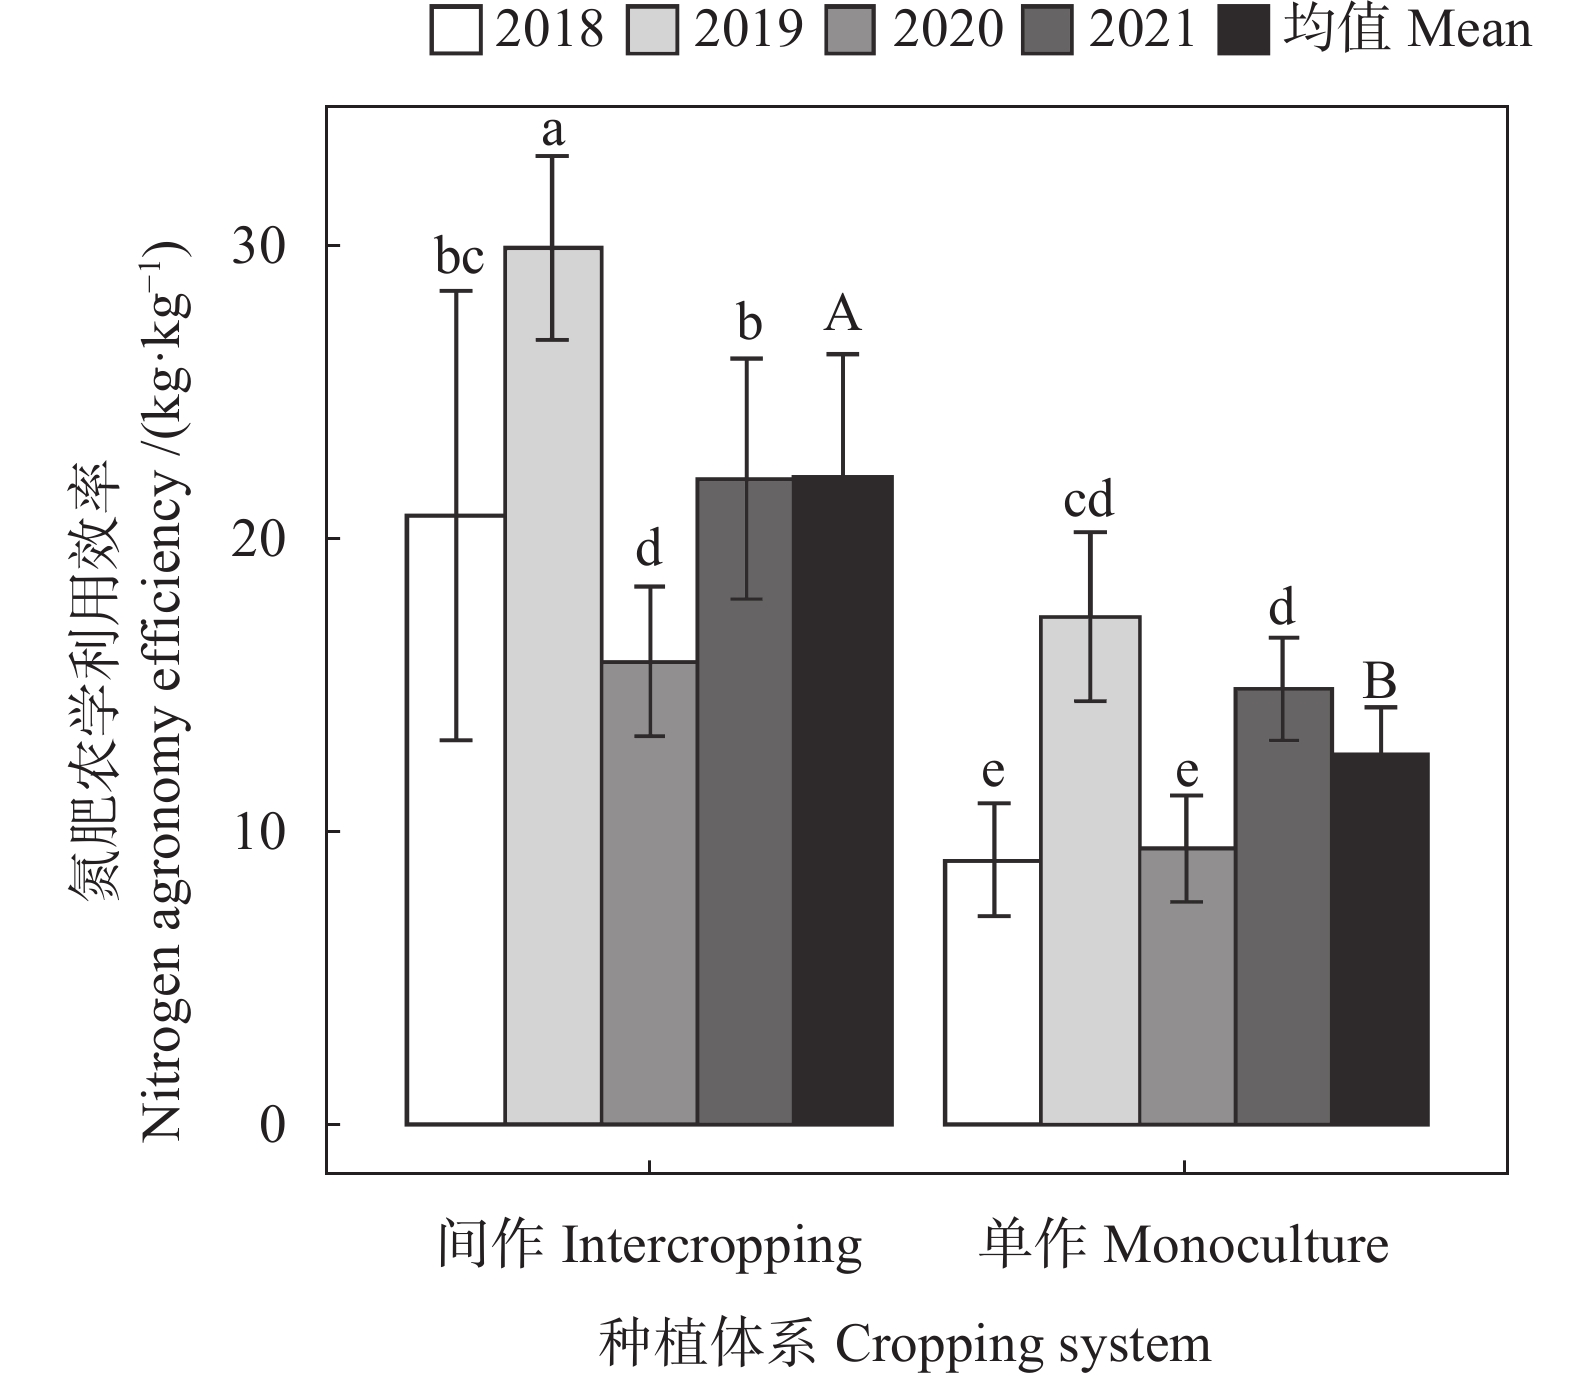
同一年份下, 间作体系氮肥农学利用效率均显著高于单作体系(图4)。无论单间作体系, 氮肥农学利用效率在年份间均存在差异, 具体表现为2019年和2021年体系氮肥农学利用效率均显著高于2018年和2020年(P<0.05)。间作体系氮肥农学利用效率4年平均值为22.3 kg·kg−1, 而单作体系氮肥仅为12.6 kg·kg−1, 间作较单作显著提高76.7 % (P<0.05)。
![]() 图 4 玉米||大豆间作体系和单作体系氮素农学利用效率不同小写字母表示氮肥农学利用效率在不同年份或体系间差异显著(P<0.05), 不同大写字母表示间作和单作体系年度平均值间差异显著(P<0.05)。Different lowercase letters indicate significant differences of agronomy efficiency of nitrogen among different years or cropping systems at P<0.05 level, and different capital letters indicate significant differences of annual average of agronomy efficiency of nitrogen between intercropping and monoculture systems at P<0.05 level.Figure 4. Nitrogen agronomy efficiency under intercropping and monoculture system
图 4 玉米||大豆间作体系和单作体系氮素农学利用效率不同小写字母表示氮肥农学利用效率在不同年份或体系间差异显著(P<0.05), 不同大写字母表示间作和单作体系年度平均值间差异显著(P<0.05)。Different lowercase letters indicate significant differences of agronomy efficiency of nitrogen among different years or cropping systems at P<0.05 level, and different capital letters indicate significant differences of annual average of agronomy efficiency of nitrogen between intercropping and monoculture systems at P<0.05 level.Figure 4. Nitrogen agronomy efficiency under intercropping and monoculture system3. 讨论
3.1 施氮对玉米||大豆体系生产力与作物产量的影响
土地当量比(LER)是表征间作作物相对单作作物土地利用效率的指标, 多用来评价间作相对于单作的产量优势, 通常LER值>1代表间作具有产量优势[21]。本研究中, 玉米||大豆体系LER值的4年平均值在两个氮水平下均>1, 这表明相对于单作, 玉米||大豆体系间作产量优势明显。赵建华等研究[15]发现, 玉米||蚕豆和玉米||豌豆间作体系均具有较高的LER值(≈1.30), 而玉米||大豆间作体系的LER值较低(1.10), 本研究中, 玉米||大豆间作体系的平均LER值为1.22。研究表明, 玉米/豆科间作体系LER值随施氮量的增加而降低[22]。从4年平均值来看, LER从N0处理的1.26降至N300处理的1.17, 这表明本研究条件下, 不施氮更有利于玉米||大豆体系间作产量优势的发挥。进一步分析偏土地当量比发现, 玉米偏土地当量比(pLERm)值均>0.5, 且施氮提高了pLERm值, 大豆偏土地当量比(pLERs)值大部分<0.5, 且施氮降低了pLERs值, 这表明玉米||大豆间作体系产量优势的主要贡献者为玉米。N0处理和N300处理下大豆的超产率分别为15%和−30%, 施氮造成大豆超产率下降的可能原因在于, 本研究中无论基肥还是追肥, 各小区施氮均匀一致, 过高的施氮量不利于间作大豆氮素的高效利用从而造成产量下降; 间作玉米超产率从N0处理的36.88%提高至N300处理的64.82%, 表明相对于单作, 施氮显著增加间作玉米产量。综上, 玉米||大豆体系间作优势主要来源于玉米的产量贡献, 且施氮增加玉米产量优势, 降低大豆产量优势。
3.2 施氮对玉米||大豆体系生产力稳定性与作物产量稳定性的影响
研究表明, 相对于单作, 间作混种可提高体系生产力稳定性[23-24]。本研究中, 考察主效应施氮量时发现,无论单间作, 施氮处理产量稳定性较不施氮提高112.7%; 考察主效应种植体系时发现, 间作体系产量稳定性较单作体系降低40.1%, 这表明施氮增强了种植体系的产量稳定性, 玉米||大豆间作体系产量稳定性弱于单作体系; 无论单作还是间作体系, 同一体系中, 施氮和不施氮处理下产量稳定性无显著差异(图2A), 这表明种植体系产量稳定性不受施氮影响。进一步分析作物产量稳定性发现, 间作种植条件下, 施氮对大豆产量稳定性无影响, 但显著提升了间作玉米产量稳定性; 单作种植条件下, 施氮显著提升了大豆产量稳定性, 而对单作玉米产量稳定性无影响。可能是因为, 单作条件下, 施氮显著增加了大豆产量, 进而增加了产量稳定性, 而间作条件下, 施氮降低了大豆产量, 进而降低了产量稳定性; 四年平均值来看, 施氮条件下单作和间作玉米产量较不施氮分别提高87.5%和126.1% (表1), 间作玉米产量的大幅增加导致氮处理间产量稳定性表现出显著差异, 而单作玉米因产量增幅较小未能形成氮处理间产量稳定性的显著差异。以上结果表明, 间作体系产量稳定性主要受大豆产量稳定性影响。研究表明, 间作的产量稳定性还依赖于特定的作物组合及氮肥施用[25-26]。在本研究条件下, 施氮后单作大豆和玉米的产量稳定性均有所提升, 间作玉米产量稳定性也有所提升, 可间作大豆的产量下降, 这也可能是导致整个间作体系产量稳定性下降的原因。因此, 本研究中玉米||大豆间作是种间物种相互竞争的间作组合, 高产优势作物玉米虽能保持较高的产量, 可是与之间作的大豆产量劣势明显不利于间作体系产量稳定性的保持, 另外, 本研究中追肥均匀施肥可能造成大豆带氮肥过剩, 从而限制间作大豆产量提升, 改变施肥方式后是否能增加玉米||大豆间作产量稳定性, 有待于进一步研究。
3.3 施氮对玉米||大豆氮素高效利用的影响
相比单作, 间作可以提高作物氮素利用效率, 研究表明玉米||大豆间作体系氮吸收当量比>1 [27-28]。多项研究也表明, 相对于单作, 间作玉米和大豆在生长速率和氮素吸收速率上的改变促成了氮素的高效利用[29-30]。本研究中, 间作体系氮肥农学利用效率的4年平均值较单作提高76.7%, 这充分说明间作体系相对于单作提高了氮素的利用效率。在东北的玉米||大豆间作体系中, 间作降低大豆籽粒产量, 但提高玉米籽粒产量[31]。本研究中, 与不施氮处理, 施氮处理间作玉米产量提升126.1%, 而单作提升87.5%, 这表明同等施氮量下, 间作玉米可以更高效地利用氮素, 从而提升产量。对于大豆来说, 单作大豆在施氮后产量提升21.3%, 间作大豆却降低27.0%, 这表明间作大豆氮素利用效率低于单作。本研究中各小区间作体系施氮量均匀一致, 因此对于大豆而言施氮量可能偏高, 从而限制了间作大豆的固氮效应, 致使产量相对于不施氮有所下降; 但对比单间作体系, 间作体系氮素农学效率显著提高。以上结果说明, 玉米||大豆间作体系氮素高效利用主要依靠间作玉米, 高产作物玉米的氮素高效利用大幅提升了间作体系的生产力, 并弥补了间作大豆产量下降对体系生产力的损失。
4. 结论
玉米||大豆间作体系土地当量比>1表明该间作体系具有间作产量优势, 施氮条件下土地当量比低于不施氮, 表明施氮降低了玉米||大豆间作体系产量优势; 玉米偏土地当量比>0.5, 大豆偏土地当量比<0.5, 间作体系产量优势主要来源于间作玉米, 施氮显著增加了间作玉米产量, 降低了间作大豆产量; 施氮均提高了单间作种植体系的产量稳定性, 间作体系产量稳定性低于单作体系; 间作体系氮肥农学利用率高于单作体系。综上, 甘肃张掖地区玉米||大豆间作体系中, 玉米是该体系中的主导作物, 提升玉米的产量是提升间作体系生产力的关键, 也是维持体系生产力稳定性的关键。
-
![]()
图 1 大豆和玉米单间作种植示意图
Figure 1. Planting diagram for soybean and maize under monoculture and intercropping systems
![]()
图 2 不同氮处理下玉米偏土地当量比(pLERm)与大豆偏土地当量比(pLERs)的关系
2018、2019、2020和2021表示年份。N0: 施氮0 kg·hm−2; N300: 施氮300 kg·hm−2。2018, 2019, 2020, and 2021 represents the years. N0: nitrogen application rate at 0 kg·hm−2; N300: nitrogen application rate at 300 kg·hm−2.
Figure 2. The relationship between partial land equivalent ratio of maize (pLERm) and partial land equivalent ratio of soybean (pLERs) under different N treatments
![]()
图 3 种植体系和施氮量对作物及体系产量稳定性的影响
N0: 施氮0 kg·hm−2; N300: 施氮300 kg·hm−2。同一图内不同小写字母表示差异显著(P<0.05)。N0: nitrogen application rate at 0 kg·hm−2; N300: nitrogen application rate at 300 kg·hm−2. Different lowercase letters in the same figure indicate significant differences at P<0.05 level.
Figure 3. The effects of cropping systems and nitrogen application rates on yield stability of crop and system
![]()
图 4 玉米||大豆间作体系和单作体系氮素农学利用效率
不同小写字母表示氮肥农学利用效率在不同年份或体系间差异显著(P<0.05), 不同大写字母表示间作和单作体系年度平均值间差异显著(P<0.05)。Different lowercase letters indicate significant differences of nitrogen agronomy efficiency among different years or cropping systems at P<0.05 level, and different capital letters indicate significant differences of annual average of nitrogen agronomy efficiency between intercropping and monoculture systems at P<0.05 level.
Figure 4. Nitrogen agronomy efficiency under intercropping and monoculture system
表 1 2018—2021年不同施氮量和不同种植体系下作物产量与超产率
Table 1 Crop yield and overyielding under different nitrogen application rates and cropping systems from 2018 to 2021
年份
Year施氮量
Nitrogen application rate大豆产量
Soybean yield /(kg·hm−2)玉米产量
Maize yield /(kg·hm−2)超产率
Overyielding /%间作
Intercropping单作
Monoculture间作
Intercropping单作
Monoculture大豆
Soybean玉米
Maize2018 N0 1 439.1 ± 171.8a 2 690.4 ± 366.8b 5 665.9 ± 820.9b 9 899.0 ± 818.1b 7.46a 15.25b N300 1 011.8 ± 161.8b 3 113.8 ± 250.8a 12 334.0 ± 1 458.1a14 882.1 ± 1 521.7a−35.28b 65.62a 2019 N0 1 713.9 ± 162.4a 1 860.4 ± 259.4b 4 960.6 ± 492.0b 7 798.8 ± 1 430.9b 56.81a 31.27b N300 1 306.5 ± 50.8b 3 055.7 ± 409.4a 14 338.4 ± 1 377.6a17 325.8 ± 875.0a−13.11b 65.42a 2020 N0 1 094.3 ± 277.4a 3 005.2 ± 45.5b 8 026.1 ± 969.3b 8 809.8 ± 415.9b −27.06a 82.97a N300 949.5 ± 287.7b 3 211.4 ± 133.2a 12 899.8 ± 1 137.5a14 241.3 ± 961.3a−40.92b 81.10a 2021 N0 1 474.8 ± 176.1a 2 420.2 ± 171.9b 3 633.2 ± 950.8b 6 094.6 ± 564.9b 21.87a 18.03b N300 908.1 ± 43.4b 2 714.8 ± 368.8a 10 812.0 ± 399.0a 14 693.3 ± 486.3a −32.52b 47.16a 均值
Mean valueN0 1 430.5 ± 196.9a 2 494.0 ± 210.9b 5 571.5 ± 808.3b 8 150.8 ± 807.4b 14.77a 36.88b N300 1 044.0 ± 135.9b 3 023.9 ± 285.5a 12 596.0 ± 1 093.0a 15 285.6 ± 961.1a −30.46b 64.82a 年份 Year (Y) ns ns ns ** ns ns 施氮量 Nitrogen application rate (N) ** ** ** ** ** ** Y × N ns ns ns ns ns ns N0: 施氮0 kg·hm−2; N300: 施氮300 kg·hm−2。同列数据后不同小写字母表示同一年份不同施氮量间差异显著(P<0.05)。**表示在P<0.01水平差异显著, ns表示差异不显著。N0: nitrogen application rate at 0 kg·hm−2; N300: nitrogen application rate at 300 kg·hm−2. Values in the same column followed by different lowercase letters indicate significant differences among different nitrogen application rates in the same year at P<0.05 level. ** indicates significant differences at P<0.01 level, and ns indicates no significant difference.  下载: 导出CSV
-
[1] 李隆. 间套作强化农田生态系统服务功能的研究进展与应用展望[J]. 中国生态农业学报, 2016, 24(4): 403−415 LI L. Intercropping enhances agroecosystem services and functioning: Current knowledge and perspectives[J]. Chinese Journal of Eco-Agriculture, 2016, 24(4): 403−415
[2] DU Q, ZHOU L, CHEN P, et al. Relay-intercropping soybean with maize maintains soil fertility and increases nitrogen recovery efficiency by reducing nitrogen input[J]. The Crop Journal, 2020, 8(1): 140−152 doi: 10.1016/j.cj.2019.06.010
[3] 林文磊, 吕美琴, 施迎迎, 等. 玉豆间作对大豆生长发育、产量、品质及群体经济产值的影响[J]. 大豆科学, 2024, 43(3): 342−351 LIN W L, LYU M Q, SHI Y Y, et al. Effects of maize and soybean intercropping on growth, quality characters and yield of different soybean varieties and group economic value[J]. Soybean Science, 2024, 43(3): 342−351
[4] 雷雲翔, 应晓成, 沈新平, 等. 玉米-大豆间作经济与环境效应研究进展[J]. 灌溉排水学报, 2023, 42(S1): 56−60 LEI Y X, YING X C, SHEN X P, et al. Research progress on economic and environmental effects of corn-soybean intercropping[J]. Journal of Irrigation and Drainage, 2023, 42(S1): 56−60
[5] 高阳, 段爱旺, 刘祖贵, 等. 单作和间作对玉米和大豆群体辐射利用率及产量的影响[J]. 中国生态农业学报, 2009, 17(1): 7−12 GAO Y, DUAN A W, LIU Z G, et al. Effect of monoculture and intercropping on radiation use efficiency and yield of maize and soybean[J]. Chinese Journal of Eco-Agriculture, 2009, 17(1): 7−12
[6] 张晓娜, 陈平, 庞婷, 等. 玉米/豆科间作种植模式对作物干物质积累、分配及产量的影响[J]. 四川农业大学学报, 2017, 35(4): 484−490 ZHANG X N, CHEN P, PANG T, et al. The effects of dry matter accumulation, distribution and yield in the maize/soybean and maize/peanut intercropping system[J]. Journal of Sichuan Agricultural University, 2017, 35(4): 484−490
[7] 肖世豪, 潘语卓, 俞霞, 等. 5年间作和施氮对甜玉米和大豆产量、农艺性状的影响[J]. 核农学报, 2023, 37(4): 822−832 doi: 10.11869/j.issn.1000-8551.2023.04.0822 XIAO S H, PAN Y Z, YU X, et al. Effect of intercropping and nitrogen rate on sweet corn and soybean yield and agronomic characteristics during 5-year field experiments[J]. Journal of Nuclear Agricultural Sciences, 2023, 37(4): 822−832 doi: 10.11869/j.issn.1000-8551.2023.04.0822
[8] 杨立达, 任俊波, 彭新月, 等. 施氮与种间距离下大豆/玉米带状套作作物生长特性及其对产量形成的影响[J]. 作物学报, 2024, 50(1): 251−264 YANG L D, REN J B, PENG X Y, et al. Crop growth characteristics and its effects on yield formation through nitrogen application and interspecific distance in soybean/maize strip relay intercropping[J]. Acta Agronomica Sinica, 2024, 50(1): 251−264
[9] 肖焱波, 李隆, 张福锁. 豆科//禾本科间作系统中氮营养研究进展[J]. 中国农业科技导报, 2003, 5(6): 44−49 doi: 10.3969/j.issn.1008-0864.2003.06.010 XIAO Y B, LI L, ZHANG F S. An outlook of the complementary nitrogen nutrition in the legume//graminaceae system[J]. Review of China Agricultural Science and Technology, 2003, 5(6): 44−49 doi: 10.3969/j.issn.1008-0864.2003.06.010
[10] ŠIMON J, ŠKRDLETA V. Biomass production in peas (Pisum sativum L.) and broad beans(Vicia faba L.) and symbiotic dinitrogen fixation as affected by ploughing or no-tillage and nitrogen fertilizer[J]. Soil and Tillage Research, 1983, 3(4): 367−375
[11] 赵财, 柴强, 乔寅英, 等. 禾豆间距对间作豌豆“氮阻遏” 减缓效应的影响[J]. 中国生态农业学报, 2016, 24(9): 1169−1176 ZHAO C, CHAI Q, QIAO Y Y, et al. Effect of cereal-legume spacing in intercropping system on alleviating “N inhibition” in pea plants[J]. Chinese Journal of Eco-Agriculture, 2016, 24(9): 1169−1176
[12] 柴强, 胡发龙, 陈桂平. 禾豆间作氮素高效利用机理及农艺调控途径研究进展[J]. 中国生态农业学报, 2017, 25(1): 19−26 CHAI Q, HU F L, CHEN G P. Research advance in the mechanism and agronomic regulation of high-efficient use of nitrogen in cereal-legume intercropping[J]. Chinese Journal of Eco-Agriculture, 2017, 25(1): 19−26
[13] 李玉英, 孙建好, 李春杰, 等. 施氮对蚕豆/玉米间作系统蚕豆农艺性状及结瘤特性的影响[J]. 中国农业科学, 2009, 42(10): 3467−3474 LI Y Y, SUN J H, LI C J, et al. Effects of interspecific interactions and nitrogen fertilization rates on the agoronmic and nodulation characteristics of intercropped faba bean[J]. Scientia Agricultura Sinica, 2009, 42(10): 3467−3474
[14] ZHAO J H, BEDOUSSAC L, SUN J H, et al. Competition-recovery and overyielding of maize in intercropping depend on species temporal complementarity and nitrogen supply[J]. Field Crops Research, 2023, 292: 108820
[15] 赵建华, 孙建好, 陈亮之, 等. 玉/豆间作产量优势中补偿效应和选择效应的角色[J]. 作物学报, 2022, 48(10): 2588−2596 ZHAO J H, SUN J H, CHEN L Z, et al. Role of complementarity and select effect for yield advantage of maize/legumes intercropping systems[J]. Acta Agronomica Sinica, 2022, 48(10): 2588−2596
[16] WILLY R W. Intercropping-Its importance and research needs. Part 2. Agronomy and research approaches[J]. Field Crop Abstracts, 1979, 32(2): 73−85
[17] LI Q Z, SUN J H, WEI X J, et al. Overyielding and interspecific interactions mediated by nitrogen fertilization in strip intercropping of maize with faba bean, wheat and barley[J]. Plant and Soil, 2011, 339(1): 147−161
[18] 李小飞. 长期间套作下作物生产力、稳定性和土壤肥力研究[D]. 北京: 中国农业大学, 2017 LI X F. Effects of continuous intercropping on crop productivity, stability and soil fertility[D]. Beijing: China Agricultural University, 2017
[19] LI X F, WANG Z G, BAO X G, et al. Long-term increased grain yield and soil fertility from intercropping[J]. Nature Sustainability, 2021, 4: 943−950 doi: 10.1038/s41893-021-00767-7
[20] 蒲宁, 罗珠珠, 张耀全. 陇中旱农区不同品种马铃薯水氮利用效率研究[J]. 干旱地区农业研究, 2024, 42(3): 98−106, 161 doi: 10.7606/j.issn.1000-7601.2024.03.11 PU N, LUO Z Z, ZHANG Y Q. Study on water and nitrogen use efficiency of different potato varieties in the dry farmlands of Longzhong[J]. Agricultural Research in the Arid Areas, 2024, 42(3): 98−106, 161 doi: 10.7606/j.issn.1000-7601.2024.03.11
[21] 赵凤艳, 张勇勇, 冯晨, 等. 不同施氮量下玉米花生间作不同玉米行对土地当量比和产量贡献的研究[J]. 中国土壤与肥料, 2023(6): 129−137 ZHAO F Y, ZHANG Y Y, FENG C, et al. Contribution of different maize rows to land equivalent ratio and yield of maize and peanut intercropping under different N application rates[J]. Soil and Fertilizer Sciences in China, 2023(6): 129−137
[22] LIU X D, MENG L B, YIN T J, et al. Maize/soybean intercrop over time has higher yield stability relative to matched monoculture under different nitrogen-application rates[J]. Field Crops Research, 2023, 301: 109015 doi: 10.1016/j.fcr.2023.109015
[23] SU Y, YU R P, XU H S, et al. Crop cultivar mixtures stabilize productivity, partly via facilitation, when conditions are less benign[J]. Field Crops Research, 2023, 302: 109046 doi: 10.1016/j.fcr.2023.109046
[24] HUANG T T, DÖRING T F, ZHAO X R, et al. Cultivar mixtures increase crop yields and temporal yield stability globally. A meta-analysis[J]. Agronomy for Sustainable Development, 2024, 44(3): 28
[25] RENARD D, TILMAN D. National food production stabilized by crop diversity[J]. Nature, 2019, 571(7764): 257−260 doi: 10.1038/s41586-019-1316-y
[26] 刘培, 邵宇婷, 王志国, 等. 减氮对华南地区甜玉米//大豆间作系统产量稳定性的影响[J]. 中国生态农业学报(中英文), 2019, 27(9): 1332−1343 LIU P, SHAO Y T, WANG Z G, et al. Effect of nitrogen reduction on yield stability of sweet maize//soybean intercropping system in South China[J]. Chinese Journal of Eco-Agriculture, 2019, 27(9): 1332−1343
[27] 吕越, 吴普特, 陈小莉, 等. 玉米/大豆间作系统的作物资源竞争[J]. 应用生态学报, 2014, 25(1): 139−146 LÜ Y, WU P T, CHEN X L, et al. Resource competition in maize/soybean intercropping system[J]. Chinese Journal of Applied Ecology, 2014, 25(1): 139−146
[28] 王雪蓉, 张润芝, 李淑敏, 等. 不同供氮水平下玉米/大豆间作体系干物质积累和氮素吸收动态模拟[J]. 中国生态农业学报(中英文), 2019, 27(9): 1354−1363 WANG X R, ZHANG R Z, LI S M, et al. Simulation of dry matter accumulation and nitrogen absorption in a maize/soybean intercropping system supplied with different nitrogen levels[J]. Chinese Journal of Eco-Agriculture, 2019, 27(9): 1354−1363
[29] 王晓维, 杨文亭, 缪建群, 等. 玉米-大豆间作和施氮对玉米产量及农艺性状的影响[J]. 生态学报, 2014, 34(18): 5275−5282 WANG X W, YANG W T, MIAO J Q, et al. Effects of maize-soybean intercropping and nitrogen fertilizer on yield and agronomic traits of maize[J]. Acta Ecologica Sinica, 2014, 34(18): 5275−5282
[30] 赵笃勤, 刘淑慧, 赵凯超. 玉米-大豆间作和减量施氮对玉米生长、产量及土壤硝态氮含量的影响[J]. 西北农业学报, 2020, 29(8): 1159−1166 ZHAO D Q, LIU S H, ZHAO K C. Effect of maize-soybean intercropping and reduced nitrogen application on maize growth, yield and soil nitrate content[J]. Acta Agriculturae Boreali-occidentalis Sinica, 2020, 29(8): 1159−1166
[31] 王雪蓉. 施氮水平对玉米/大豆间作干物质累积和养分吸收的影响[D]. 哈尔滨: 东北农业大学, 2019 WANG X R. Effects of nitrogen supply level on dry matter accumulation and nutrient absorption in maize/soybean intercropping system[D]. Harbin: Northeast Agricultural University, 2019


计量
- 文章访问数: 69
- HTML全文浏览量: 18
- PDF下载量: 18
