
The impact of nitrogen application on antioxidant characteristics of dryland potato leaves and yield in the mountainous region of southern Ningxia, China
-
摘要:
旱作马铃薯生育中后期缺氮易引发叶片早衰, 研究不同施氮量对旱地马铃薯抗氧化特性、干物质积累特性及产量的影响, 探究适合宁夏南部山区马铃薯生产的适宜施氮量, 可以为该地区马铃薯绿色高效栽培提供技术支撑。本研究于2019—2020年在宁夏海原县开展试验, 以‘青薯9号’为供试材料, 采取随机区组试验设计, 共设置0 kg·hm−2 (N0)、75 kg·hm−2 (N1)、150 kg·hm−2 (N2)和225 kg·hm−2 (N3) 4个氮素处理, 测定其叶片抗氧化酶活性、脯氨酸(Pro)含量及干物质质量等相关参数。2年研究结果表明, 适宜施氮量可显著增加马铃薯产量、改善干物质积累特性和延缓叶片衰老, 其中以N2处理(施氮量为150 kg·hm−2)总体表现最佳。与N0相比, 各施氮处理在马铃薯生育后期(苗后90~105 d)的叶面积指数(LAI) 和叶片相对叶绿素含量(SPAD)显著增加, 同时对抗氧化酶活性的提升和干物质积累特性的持续优化均有一定效果, 其中, 以N2处理的总体优势最为显著。此外, N2较其他处理可提高马铃薯生育后期叶片超氧化物歧化酶(SOD)、过氧化氢酶(CAT)、过氧化物酶(POD)活性, 显著降低丙二醛(MDA)和脯氨酸(Pro)含量, 并显著提高最大干物质积累速率(Gmax)和达到最大干物质积累速率时的生长量(Wmax), 持续改善干物质积累特性, 增加块茎干物质质量, 进而提升产量。产量回归方程表明, 达到最大理论产量的最佳施氮范围为150~196 kg·hm−2 (2019年)和150~169 kg·hm−2 (2020年)。相关性分析结果表明, 马铃薯产量与其叶片SOD、POD和CAT活性、最大干物质积累速率(Gmax)和干物质活跃积累天数(D)呈显著或极显著正相关, 同时产量和干物质积累特性均与叶片MDA、Pro含量呈显著或极显著负相关。因此, 施氮量为150 kg·hm−2 (N2)能显著优化马铃薯干物质积累特性, 提高生育后期叶片保护酶活性, 减少膜脂过氧化产物(MDA)的积累, 可作为宁夏旱作区马铃薯绿色高产、高效栽培推荐施氮量。
Abstract:Nitrogen deficiency in the middle and late stages of dryland potato is prone to cause early leaf failure. Therefore, it is important to study the effects of different nitrogen applications on the antioxidant characteristics, dry matter accumulation characteristics, and yield of dryland potatoes and to explore the appropriate nitrogen application rate suitable for potato production in the mountainous areas of southern Ningxia. This research will contribute to the provision of technological support for green and efficient potato cultivation in this region. The experiment was carried out in Haiyuan County, Ningxia, in 2019–2020, with ‘Qingshu No. 9’ as the test material, adopting a randomized block group experimental design. A total of four nitrogen treatments, including 0 kg·hm−2 (N0), 75 kg·hm−2 (N1), 150 kg·hm−2 (N2) and 225 kg·hm−2 (N3), were applied. Parameters related to antioxidant enzyme activity, non-enzymatic protective substances and dry matter mass were determined. The results of the two years study showed that the appropriate N application rate could increase potato yield, improve the dry matter accumulation characteristics and delay leaf senescence, with the best performance under the N2 treatment (N application rate of 150 kg·hm−2). Compared with no N fertilization, all N treatments increased leaf area index and leaf relative chlorophyll content at the late reproductive stage of potatoes (90–105 d after seedling). Simultaneously, appropriate N application rate could increase antioxidant enzyme activity and optimize the characteristics of dry matter accumulation, and the advantage of N2 treatment was obvious. Compared with other treatments, N2 treatment can increase the activity of superoxide dismutase (SOD), catalase (CAT) and peroxidase (POD) in the late reproductive stage of potatoes, and effectively reduce the content of malondialdehyde (MDA) and proline (Pro). In addition, N2 treatment can increase the maximum dry matter accumulation rate (Gmax) and growth at maximum rate of dry matter accumulation (Wmax), and prolonged the number of days of active dry matter accumulation (D). This improved the dry matter accumulation characteristics, increased the dry matter quality of tubers, and enhanced the yield. Meanwhile, the yield regression equations showed that the optimal N application range for the maximum theoretical yield was 150–196 kg·hm−2 (2019) and 150–169 kg·hm−2 (2020), which could provide a reliable N application program for high potato yields in the region. Correlation analysis showed that potato yield was significantly and positively correlated with leaf SOD, POD, and CAT activities, Gmax and D. Yield and dry matter accumulation were significantly and negatively correlated with the content of leaf MDA and Pro. Therefore, an N application rate of 150 kg·hm−2 (N2) can effectively optimize the dry matter accumulation characteristics of potatoes, improve the activity of leaf protective enzymes in the late stage of reproduction, and reduce the accumulation of membrane lipid peroxidation products, and it can be used as the recommended N application rate for green, high-yield and high-efficiency cultivation of potatoes in the dry zone of Ningxia.
-
马铃薯(Solanum tuberosum L.)是全球重要的粮食作物, 也是我国第四大主粮作物[1], 其对中国粮食安全及国民经济发展起着举足轻重的作用[2-3]。马铃薯叶片是其进行光合作用的主要场所, 通过光合作用, 叶片能将阳光中的能量转化为化学能, 储存在体内, 为其生长发育提供能量[4]。若叶片提前衰老势必对马铃薯后期产量和品质提升带来挑战[5]。氮素是作物生长所必需的大量营养元素之一, 也是旱地土壤最为缺乏的营养元素, 施氮可作为作物补充氮素方式, 然而, 过量施氮情况下氮素不仅不会被植物吸收利用, 还会通过淋溶、挥发等方式流失, 严重情况下还会导致作物衰老死亡[6-9]。氮素是叶绿素的重要组成, 氮素缺乏会影响叶绿素含量, 并导致叶片早衰和减产, 过量氮素易造成功能叶片贪青徒长且对土壤环境生态平衡、农业绿色高效发展不利[10]; 合理施氮可达到节本增效的目的[11]。国内外针对施氮量均开展了大量研究, 例如, 构建不同稻区水稻(Oryza sativa L.)产量、活性氮排放与施氮量定量关系模型, 提出以区域适宜施氮量为核心、可持续生产为目标的水稻氮肥分区控制策略, 以上为世界水稻高质量发展带来机遇; 以氮肥环境收益和区域产量经济损失上限对比作为该区域作物推荐施氮量的方法在陆续实施, 该方法以聚焦优化施氮量、减少化肥污染并提升作物产量为目的。因此, 优化施氮量一直是农业领域的一个重要研究课题。
在马铃薯生产中, 适量氮肥可促进其叶片生长, 提高叶绿素含量和光合作用效率, 从而增加产量[12]。然而, 过量氮肥施用可导致叶片过早衰老, 这是由于过多氮肥施用导致叶片中硝酸盐含量明显增加, 进而引发叶片黄化、萎蔫直至衰老, 并且其叶绿素含量后期下降明显[13], 同时还可导致土壤养分失衡, 影响其他营养元素吸收, 进而影响马铃薯生长和产量形成[14]。因此, 合理的氮肥运筹是提高旱地马铃薯产量的重要措施。在实际生产中, 需要根据马铃薯品种和生长期等因素, 科学调整施氮量, 以达到最佳的产量和品质。前人试验表明, 与不施氮肥相比, 增施氮肥可推迟马铃薯生育期, 并延长块茎和植株干物质快速积累时间, 但是过量施氮会导致其产量明显下降, 以上是由马铃薯源-库关系失调所致[15]。此外, 氮素供给不足也会抑制作物体内抗氧化酶活性、增加丙二醛和活性氧等有害物质积累, 造成叶片提前衰老, 影响其正常的光合作用, 最终导致其产量和品质下降[16], 而适宜施氮量可有效保证作物生育后期叶片中抗氧化酶活性, 降低丙二醛含量, 延缓叶片衰老, 为产量形成提供基础保障[17-18]。
目前, 合理的氮肥运筹对提高作物产量和叶绿素含量以及延缓衰老等机理研究在水稻和玉米(Zea mays L.)等作物上的应用较多, 但在马铃薯生产实践中的研究和应用相对较少。前人研究主要集中在以合理施氮来优化马铃薯淀粉积累量特性、提高氮肥利用率和经济效益以及用于缓解逆境胁迫等[19]。由此, 本文将集中探讨优化施氮量在马铃薯生育后期保障充足氮素供给、维持叶片抗氧化酶活性、减少膜脂过氧化产物积累等方面的作用, 以期确定适宜施氮量, 进而为宁夏旱作马铃薯延衰增产和绿色高效栽培提供支撑。
1. 材料与方法
1.1 试验材料与设计
本试验于2019—2020年在宁夏海原县 (36°56′N, 105°64′E)开展, 该地处于宁夏中部干旱带, 属于典型的温带大陆性季风气候, 海拔高度约2150 m, 常年平均降水量可达367.40 mm, 年均蒸发量2200 mm, 年平均气温7.3℃, 无霜期149~171 d。2020年为平水年, 马铃薯生育期内平均降水量相对较低(367.70 mm); 2019年为丰水年, 生育期内平均降水量达503.90 mm (图1)。该地土壤类型为侵蚀黑垆土, 于播种前取0~20 cm土层土壤样品测定基础肥力(表1)。
![]() 图 1 2019—2020年试验地马铃薯生育期月降水量和月均温Figure 1. Monthly precipitation and mean monthly temperature of the test site during the growth stage of potato from 2019 to 2020表 1 土壤基础肥力水平Table 1. Basic fertility level of tested soil
图 1 2019—2020年试验地马铃薯生育期月降水量和月均温Figure 1. Monthly precipitation and mean monthly temperature of the test site during the growth stage of potato from 2019 to 2020表 1 土壤基础肥力水平Table 1. Basic fertility level of tested soil年份
YearpH 有机质
Organic matter
(g·kg−1)全氮
Total N
(g·kg−1)全磷
Total P
(g·kg−1)碱解氮
Alkali-hydrolyzed nitrogen
(mg·kg−1)速效磷
Available P
(mg·kg−1)速效钾
Available K
(mg·kg−1)2019 8.08 12.09 0.95 0.68 58.79 50.28 168.58 2020 7.45 10.08 0.88 0.68 37.22 28.34 189.03 试验以当地主栽品种‘青薯9号’为研究材料。采用单因素随机区组设计, 设置0 kg·hm−2、75 kg·hm−2、150 kg·hm−2和225 kg·hm−2 共4个氮素水平, 分别用N0、N1、N2、N3表示。每个处理3次重复, 每个小区长10 m、宽8 m, 小区间留1 m宽通道; 每年5月9日播种, 采用起垄覆膜种植, 垄宽60 m, 株距40 cm, 种植深度20~25 cm, 每个处理内株距30 cm, 种植密度50 097.50株·hm−2, 出苗率达85%。各处理内磷、钾肥均作为基肥施用, 且用量与大田常规用量保持一致(P2O5: 120 kg·hm−2; K2O: 90 kg·hm−2), 氮肥使用量按一定比例进行分配(60%作基肥、40%作追肥在现蕾前期施用)。于当年10月9日开始收获并测产, 其他田间管理与实际生产一致, 2年均为同期播种、处理、收获并测产。
1.2 测定指标及方法
1.2.1 马铃薯干物质积累特性及分配
于马铃薯出苗45 d、60 d、75 d、90 d和105 d采样, 每个处理选取3株长势一致的植株, 各部位分装后放入烘箱, 105℃杀青 30 min, 80℃烘干至恒重, 测定干物质质量。利用Logistic 方程模拟干物质积累过程并推导相应参数, 如下所示:
$$ y=a/(1+b\times\mathrm{e}^{-cx}) $$ (1) $$ \mathrm{\mathit{T}_{max}}=(\mathrm{ln}b)/c $$ (2) $$ \mathrm{\mathit{W}_{max}}=a/2 $$ (3) $$ \mathrm{\mathit{G}_{max}}=(c\times\mathrm{\mathit{W}_{max}})\times(1\mathrm{-\mathit{W}_{max}}/a) $$ (4) $$ D= 6/c$$ (5) $$ \mathrm{\mathit{T}}_1=(1/c)\times\mathrm{ln}[b/(2+\sqrt{3})] $$ (6) $$ \mathit{\mathrm{\mathit{T}}}_2=(1/c)\times\mathrm{ln}[b/(2-\sqrt{3})] $$ (7) 式中: y为马铃薯干物质积累量, a为终极生长量, b为初始参数, c为生长速率参数, x为出苗后天数, Tmax为达到最大积累速率的天数, Wmax为达到最大干物质积累速率时的生长量, Gmax为最大干物质积累速率, D为干物质活跃积累天数, T1为快速生长起始期, T2为快速生长结束期。
1.2.2 叶面积指数(LAI)测定
每个处理分别于马铃薯出苗后45 d、60 d、75 d、90 d和105 d选择3株长势一致且具有代表性的植株, 测定叶片长(cm)和宽(cm), 并计算叶面积指数, 如下式:
$$ \mathrm{LAI}=\mathrm{单株叶面积}\times\mathrm{单位土地面积株数} $$ (8) 1.2.3 马铃薯叶片叶绿素相对含量(SPAD)
每个处理于马铃薯出苗后45 d、60 d、75 d、90 d和105 d选取 10 株生长一致的代表性植株, 在晴朗无风的上午9:00—12:00采用便携式叶绿素仪SPAD-502测定其SPAD值。
1.2.4 马铃薯叶片抗氧化酶活性以及丙二醛和脯氨酸含量
分别在马铃薯出苗后45 d、60 d、75 d、90 d和105 d选择具有代表性的功能叶片做好标记, 并分装放入采样箱带回实验室, 采用NBT (氮蓝四唑)光还原法[20]测定超氧化物歧化酶(SOD)活性, 紫外吸收法[20]测定过氧化氢酶(CAT)活性, 愈创木酚法[20]测定过氧化物酶(POD)活性, 双组分分光光度计法[20]测定丙二醛(MDA)含量, 磺基水杨酸提取法[20]测定脯氨酸(Pro)含量[20]。
1.2.5 考种与测产
考种于马铃薯收获期(10月9日)在每个小区中部2垄随机选取10株进行, 主要统计每穴薯重、每穴薯块数、结薯数等, 按照吕文河等[21]对商品薯薯块分类方法进行分类(薯块重量>150 g为大薯, 75~150 g为中薯, <75 g为小薯), 并进一步计算大中小薯率。产量测定则选取每个小区中部两垄进行, 收获所有植株块茎称重, 并换算成小区产量和单位面积产量。
1.3 数据处理
采用 Microsoft Excel 2019进行数据处理, 使用IBM SPSS Statistics 27.0.1对数据进行统计分析, GraphPad Prism 9.5.1、Origin 2021和微生信平台(www.bioinformatics.com.cn)进行图片绘制, 采用CurveExpert Professional 2.6.5进行曲线方程拟合, 采用LSD 法进行差异显著性检验。
2. 结果与分析
2.1 施氮量对旱地马铃薯叶面积指数的影响
如图2所示, 马铃薯叶面积指数(LAI) 在研究期间均随其生育进程推进呈单峰趋势, 在出苗后75 d达最大值。与N0相比, 施氮处理可明显增加旱地马铃薯各生育期内LAI。2019年苗后75 d, N1、N2和N3处理的LAI较N0分别显著提高13.36%、20.09%和11.07% (P<0.05), 2020年则显著提高10.78%、39.75%和33.07% (P<0.05)。随后各处理LAI开始逐渐下降, 与N0相比, 施用一定量氮肥后LAI下降速度更为缓慢。苗后105 d, 2019年丰水年N0处理较N1、N2和N3分别显著下降24.17%、30.45%和27.19% (P<0.05), 而2020年平水年则显著下降34.66%、45.19%和41.17% (P<0.05)。
![]() 图 2 2019年和2020年施氮量对旱地马铃薯叶面积指数(LAI)的影响N0: 施氮量为0 kg·hm−2; N1: 施氮量为75 kg·hm−2; N2: 施氮量为150 kg·hm−2; N3: 施氮量为225 kg·hm−2。N0: no N application; N1: N application rate at 75 kg(N)·hm−2; N2: N application rate at 150 kg(N)·hm−2; N3: N application rate at 225 kg(N)·hm−2.Figure 2. Effect of nitrogen application rate on leaf area index (LAI) of dryland potatoes in 2019 and 2020
图 2 2019年和2020年施氮量对旱地马铃薯叶面积指数(LAI)的影响N0: 施氮量为0 kg·hm−2; N1: 施氮量为75 kg·hm−2; N2: 施氮量为150 kg·hm−2; N3: 施氮量为225 kg·hm−2。N0: no N application; N1: N application rate at 75 kg(N)·hm−2; N2: N application rate at 150 kg(N)·hm−2; N3: N application rate at 225 kg(N)·hm−2.Figure 2. Effect of nitrogen application rate on leaf area index (LAI) of dryland potatoes in 2019 and 20202.2 施氮量对旱地马铃薯叶片SPAD值的影响
由图3可知, 马铃薯叶片SPAD值随生育进程推进呈先升后降趋势, 于出苗后75 d达到峰值。与N0相比, 合理施氮可提高马铃薯叶片SPAD值, 其中以N2表现最佳。2019年苗后75 d, N1、N2和N3较N0分别显著提高3.35%、10.51%和5.35% (P<0.05), 2020年虽略有提高, 但均不显著; 生育后期(苗后105 d), 2019年N1、N2和N3处理的SPAD较N0分别显著提高5.06%、7.58%、2.83% (P<0.05), 2020年分别显著提高10.39%、16.24%、14.83% (P<0.05)。
![]() 图 3 2019年和2020年施氮量对旱地马铃薯叶片SPAD值的影响N0: 施氮量为0 kg·hm−2; N1: 施氮量为75 kg·hm−2; N2: 施氮量为150 kg·hm−2; N3: 施氮量为225 kg·hm−2。N0: no N application; N1: N application rate at 75 kg·hm−2; N2: N application rate at 150 kg·hm−2; N3: N application rate at 225 kg·hm−2.Figure 3. Effect of nitrogen application rate on SPAD values of dryland potato leaves in 2019 and 2020
图 3 2019年和2020年施氮量对旱地马铃薯叶片SPAD值的影响N0: 施氮量为0 kg·hm−2; N1: 施氮量为75 kg·hm−2; N2: 施氮量为150 kg·hm−2; N3: 施氮量为225 kg·hm−2。N0: no N application; N1: N application rate at 75 kg·hm−2; N2: N application rate at 150 kg·hm−2; N3: N application rate at 225 kg·hm−2.Figure 3. Effect of nitrogen application rate on SPAD values of dryland potato leaves in 2019 and 20202.3 施氮量对旱地马铃薯叶片抗氧化特性的影响
2.3.1 对丙二醛(MDA)含量的影响
由图4可知, 随马铃薯生育进程推进, 其丙二醛含量(MDA)呈逐步上升趋势, 在出苗后105 d达峰值。与N0相比, 合理施氮量可显著降低叶片MDA含量, 延缓其在生育后期的上升速度, 其中N2处理效果最优。苗后105 d, 2019年N2处理的MDA含量与其他处理相比分别显著降低30.02%、13.60%和7.05% (P<0.05), 2020年则分别显著降低23.45%、20.54%和7.56% (P<0.05)。对比各处理苗后105 d的MDA含量发现, 2020年(平水年)较2019年(丰水年) MDA含量显著增加, N0、N1、N2和N3分别显著增加0.81%、19.92%、10.26%和10.88% (P<0.05)。
![]() 图 4 2019年和2020年施氮量对旱地马铃薯叶片丙二醛(MDA)含量的影响N0: 施氮量为0 kg·hm−2; N1: 施氮量为75 kg·hm−2; N2: 施氮量为150 kg·hm−2; N3: 施氮量为225 kg·hm−2。N0: no N application; N1: N application rate at 75 kg·hm−2; N2: N application rate at 150 kg·hm−2; N3: N application rate at 225 kg·hm−2.Figure 4. Effect of nitrogen application rate on malondialdehyde (MDA) content of dryland potato leaves in 2019 and 2020
图 4 2019年和2020年施氮量对旱地马铃薯叶片丙二醛(MDA)含量的影响N0: 施氮量为0 kg·hm−2; N1: 施氮量为75 kg·hm−2; N2: 施氮量为150 kg·hm−2; N3: 施氮量为225 kg·hm−2。N0: no N application; N1: N application rate at 75 kg·hm−2; N2: N application rate at 150 kg·hm−2; N3: N application rate at 225 kg·hm−2.Figure 4. Effect of nitrogen application rate on malondialdehyde (MDA) content of dryland potato leaves in 2019 and 20202.3.2 对超氧化物歧化酶(SOD)活性的影响
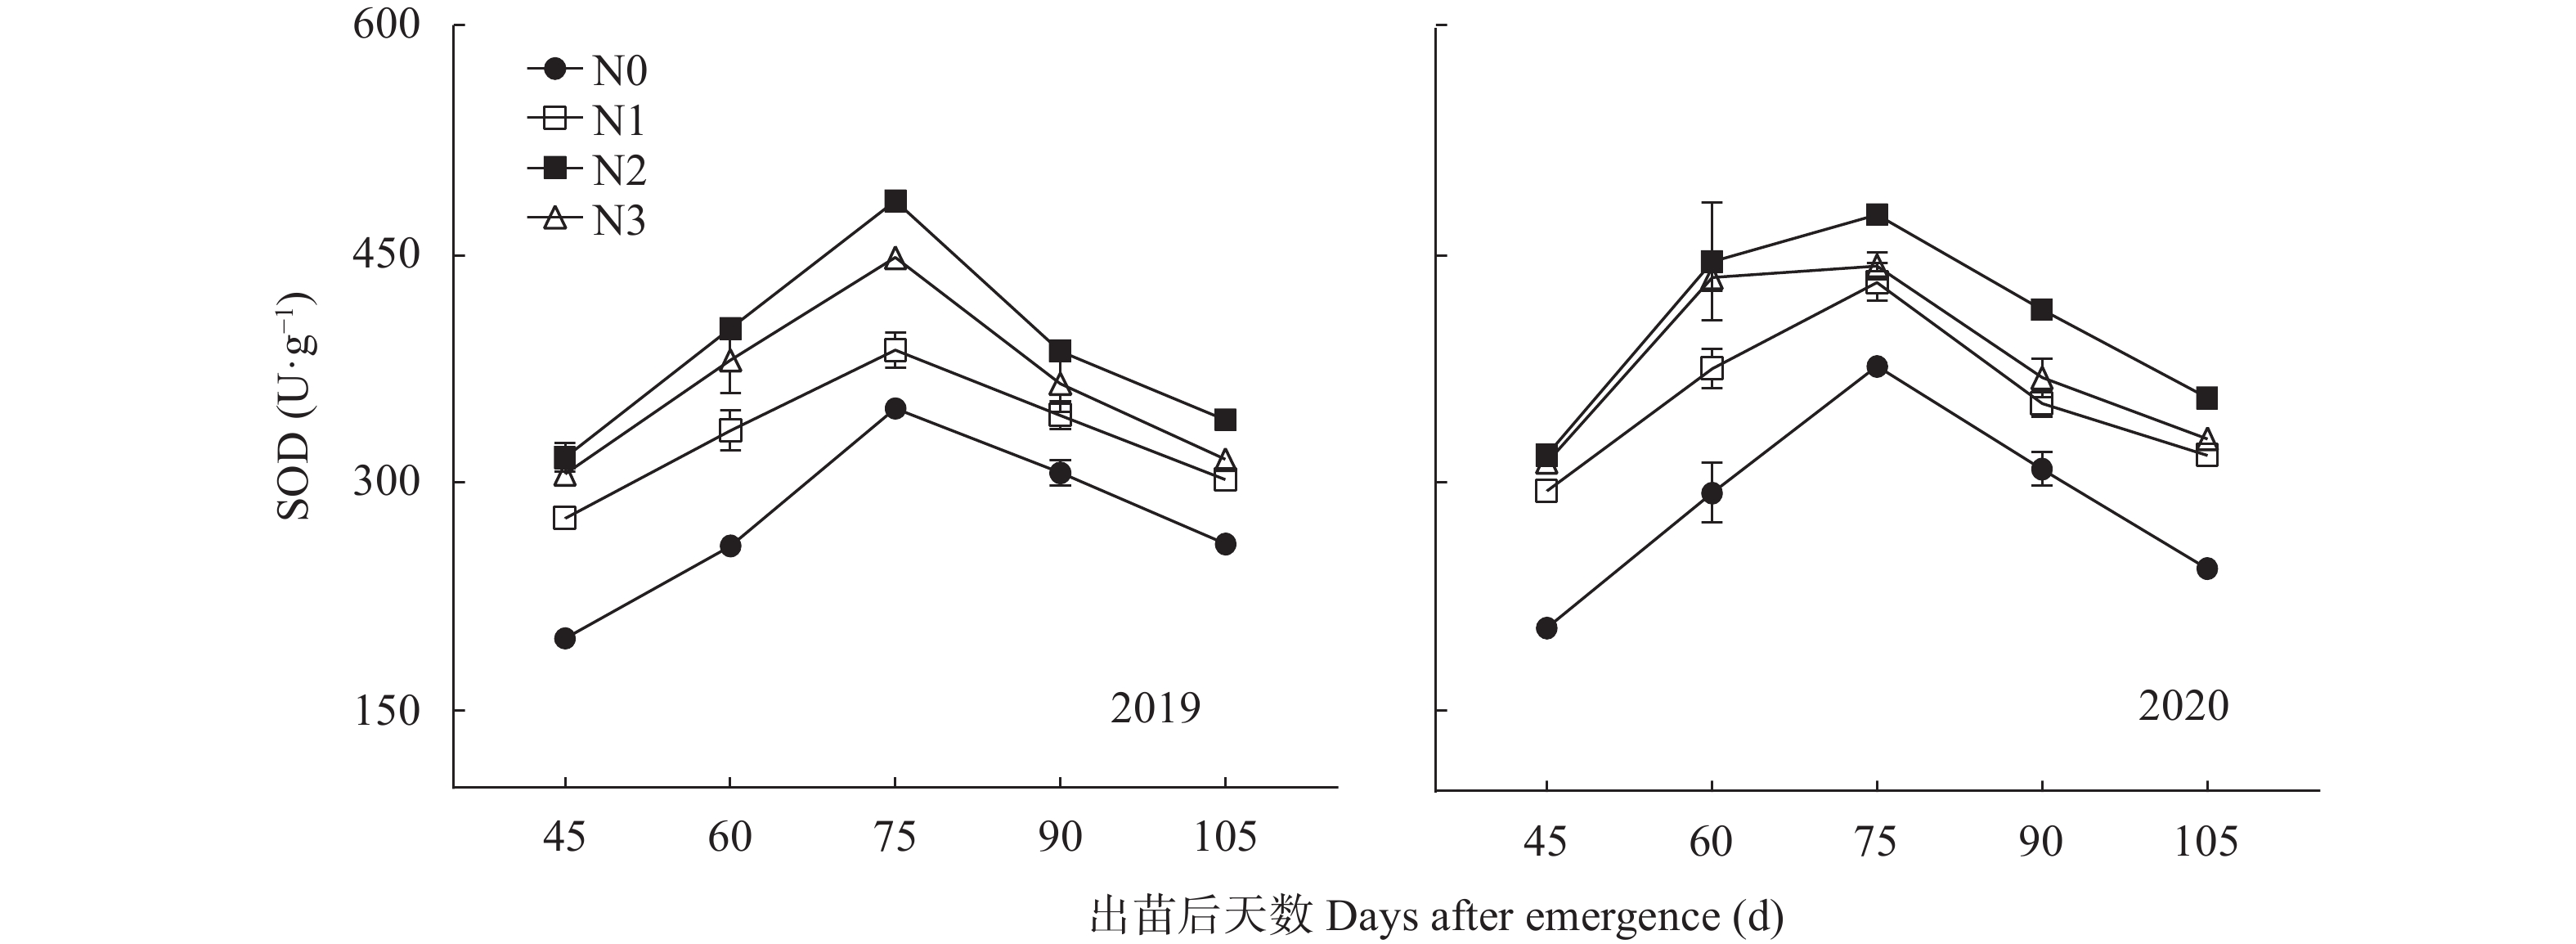
如图5所示, 随马铃薯生育期推进, 其超氧化物酶活性(SOD)呈单峰趋势, 在出苗后75 d达峰值。与N0相比, 合理施氮可显著提高SOD活性, 以N2处理效果最好。苗后75 d, 2019年N2处理的SOD活性较N0、N1和N3分别显著提高39.17%、25.36%和8.31% (P<0.05), 2020年则显著提高26.51%、10.18%和7.50% (P<0.05)。马铃薯苗后105 d, 2019年N1、N2和N3处理SOD活性较N0分别显著增高16.34%、31.54%和21.44% (P<0.05), 2020年则显著提高30.44%、45.72%和34.75% (P<0.05)。
![]() 图 5 2019年和2020年施氮量对旱地马铃薯叶片超氧化物歧化酶活性(SOD)的影响N0: 施氮量为0 kg·hm−2; N1: 施氮量为75 kg·hm−2; N2: 施氮量为150 kg·hm−2; N3: 施氮量为225 kg·hm−2。N0: no N application; N1: N application rate at 75 kg·hm−2; N2: N application rate at 150 kg·hm−2; N3: N application rate at 225 kg·hm−2.Figure 5. Effect of nitrogen application rate on superoxide dismutase (SOD) activity of dryland potato leaves in 2019 and 2020
图 5 2019年和2020年施氮量对旱地马铃薯叶片超氧化物歧化酶活性(SOD)的影响N0: 施氮量为0 kg·hm−2; N1: 施氮量为75 kg·hm−2; N2: 施氮量为150 kg·hm−2; N3: 施氮量为225 kg·hm−2。N0: no N application; N1: N application rate at 75 kg·hm−2; N2: N application rate at 150 kg·hm−2; N3: N application rate at 225 kg·hm−2.Figure 5. Effect of nitrogen application rate on superoxide dismutase (SOD) activity of dryland potato leaves in 2019 and 20202.3.3 对过氧化物酶(POD)活性的影响
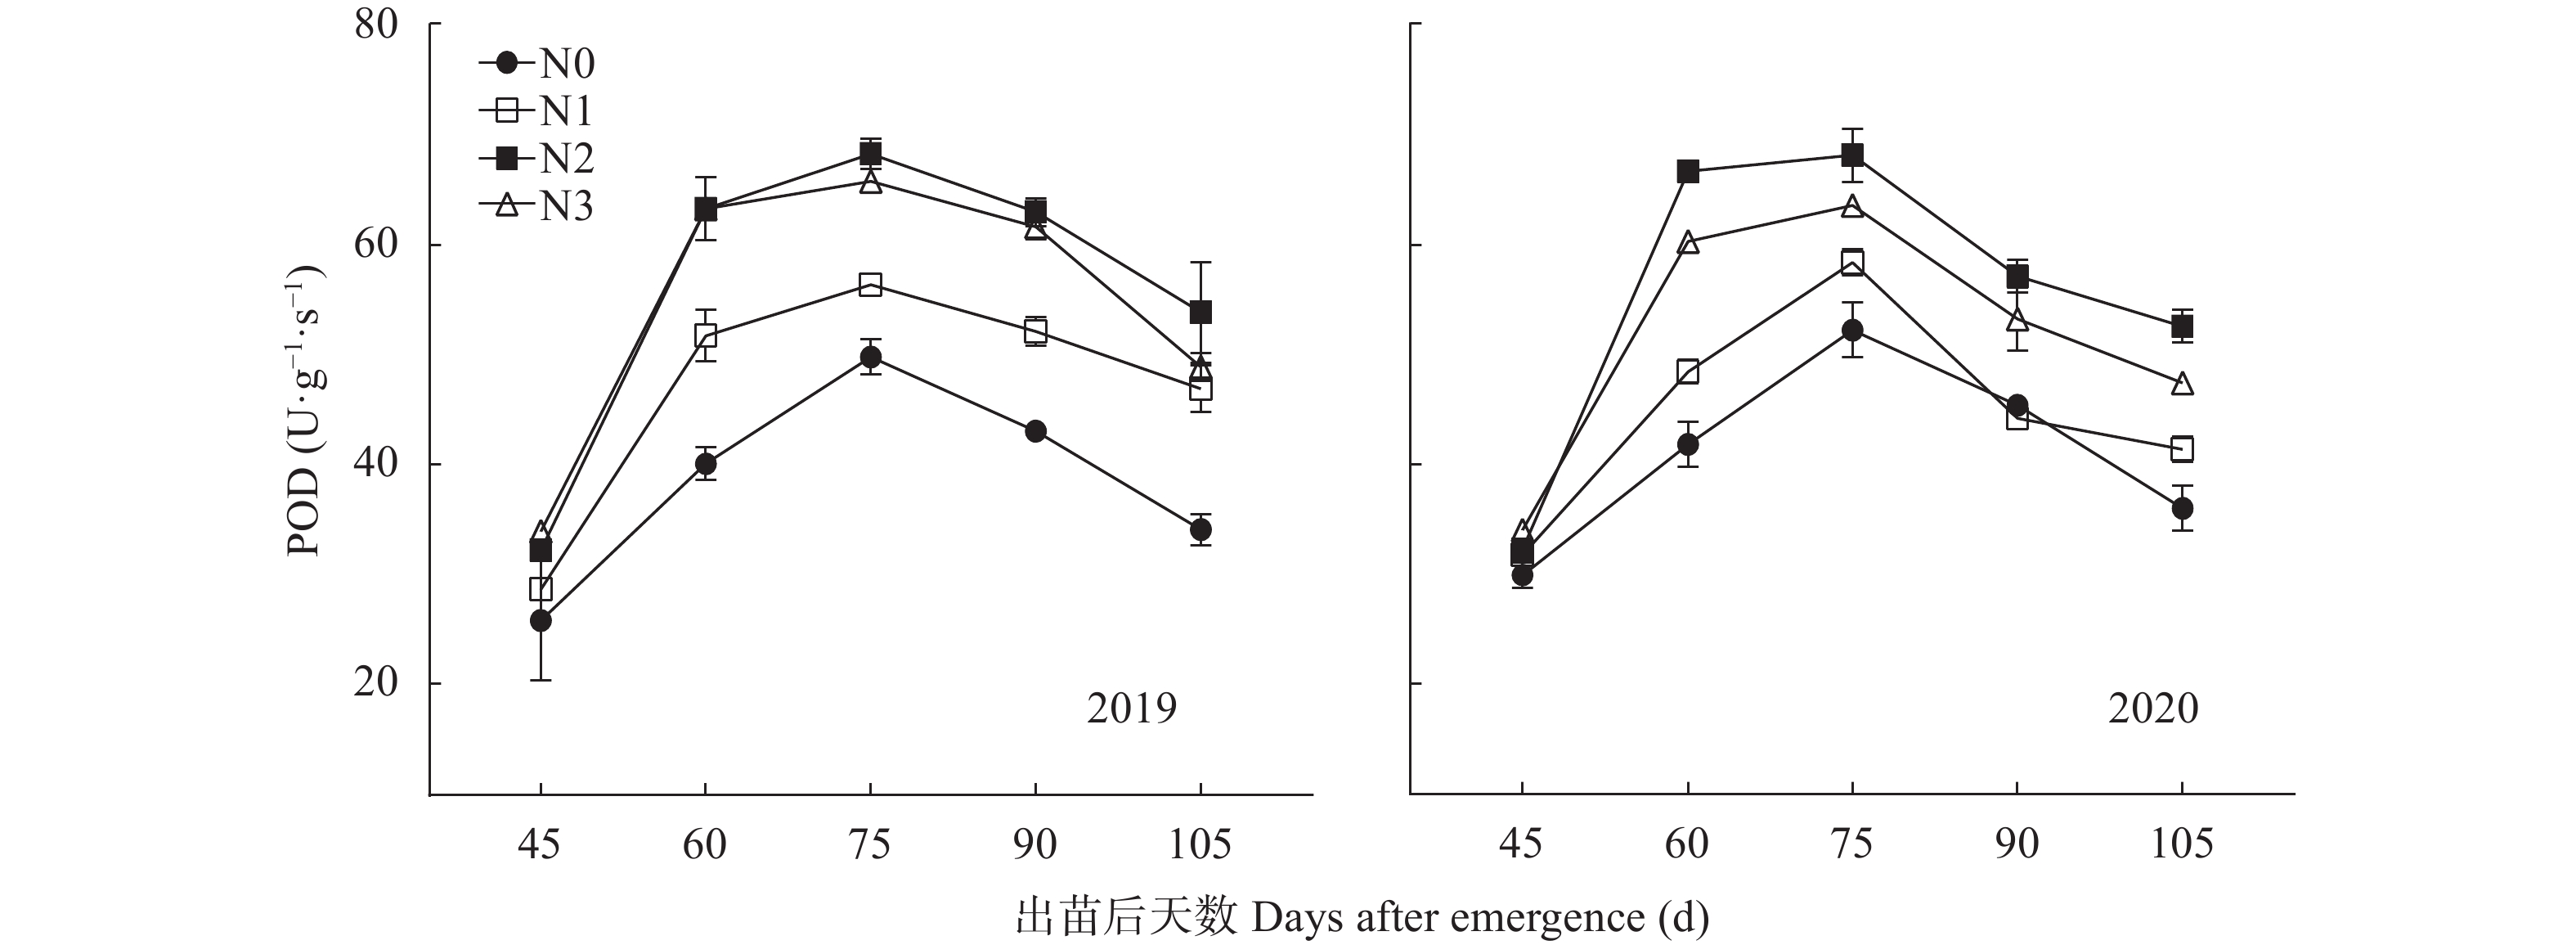
由图6可知, 随马铃薯生育进程推进, 其过氧化物酶活性(POD)呈单峰趋势, 在出苗后75 d达峰值。与不施氮肥相比, 合理施氮可显著提高POD活性, 以N2处理效果最好。苗后75 d , 2019年N2处理的POD活性较N0、N1和N3分别显著增加37.13%、30.98%和3.80% (P<0.05), 2020年则分别显著增加30.47%、12.91%和7.17% (P<0.05)。苗后105 d, 2019年N1、N2和N3处理的POD活性较N0分别显著提高37.82%、58.22%和43.54% (P<0.05), 2020年则显著增加15.00%、46.22%和31.78% (P<0.05)。
![]() 图 6 2019年和2020年施氮量对旱地马铃薯叶片过氧化物酶活性(POD)的影响N0: 施氮量为0 kg·hm−2; N1: 施氮量为75 kg·hm−2; N2: 施氮量为150 kg·hm−2; N3: 施氮量为225 kg·hm−2。N0: no N application; N1: N application rate at 75 kg·hm−2; N2: N application rate at 150 kg·hm−2; N3: N application rate at 225 kg·hm−2.Figure 6. Effect of nitrogen application rate on peroxidase (POD) activity of dryland potato leaves in 2019 and 2020
图 6 2019年和2020年施氮量对旱地马铃薯叶片过氧化物酶活性(POD)的影响N0: 施氮量为0 kg·hm−2; N1: 施氮量为75 kg·hm−2; N2: 施氮量为150 kg·hm−2; N3: 施氮量为225 kg·hm−2。N0: no N application; N1: N application rate at 75 kg·hm−2; N2: N application rate at 150 kg·hm−2; N3: N application rate at 225 kg·hm−2.Figure 6. Effect of nitrogen application rate on peroxidase (POD) activity of dryland potato leaves in 2019 and 20202.3.4 对过氧化氢酶(CAT)活性的影响
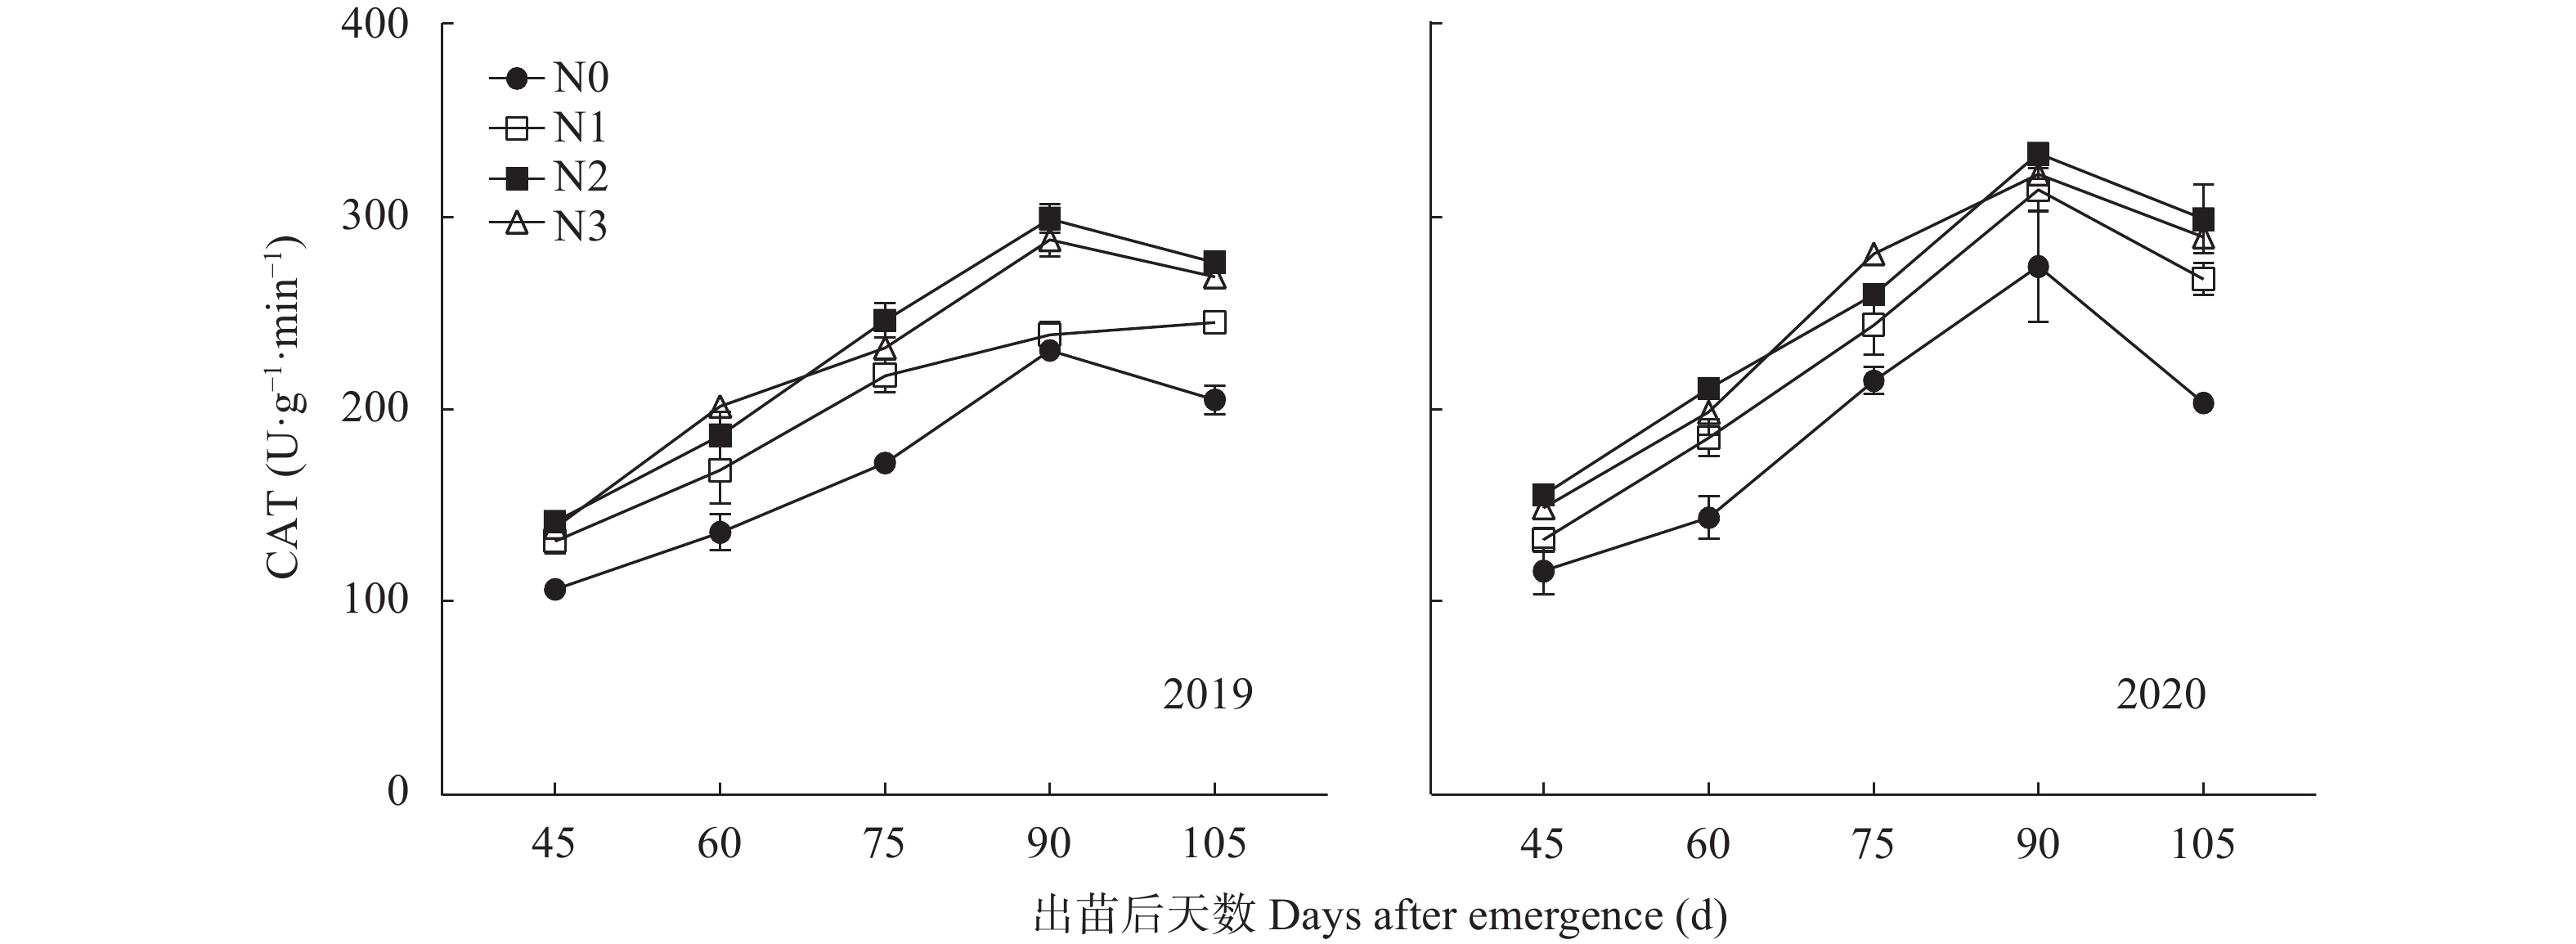
如图7所示, 随马铃薯生育进程推进, 其过氧化氢酶活性(CAT)呈先增后降趋势, 在出苗后90 d达峰值。与N0相比, 合理施氮可显著提高CAT活性, 以N2处理效果最优。苗后90 d, 2019年N2处理的CAT活性较N0、N1和N3分别显著提高29.48%、25.38%和3.75% (P<0.05), 2020年则显著提高21.51%、6.04%和3.31% (P<0.05)。苗后105 d , 2019年N1、N2和N3处理的CAT活性分别较N0显著提高19.85%、34.93%和31.33% (P<0.05), 2020年则显著增加31.98%、47.34%和42.82% (P<0.05)。
![]() 图 7 2019年和2020年施氮量对旱地马铃薯叶片过氧化氢酶活性(CAT)的影响N0: 施氮量为0 kg·hm−2; N1: 施氮量为75 kg·hm−2; N2: 施氮量为150 kg·hm−2; N3: 施氮量为225 kg·hm−2。N0: no N application; N1: N application rate at 75 kg·hm−2; N2: N application rate at 150 kg·hm−2; N3: N application rate at 225 kg·hm−2.Figure 7. Effect of nitrogen application rate on catalase (CAT) activity of dryland potato leaves in 2019 and 2020
图 7 2019年和2020年施氮量对旱地马铃薯叶片过氧化氢酶活性(CAT)的影响N0: 施氮量为0 kg·hm−2; N1: 施氮量为75 kg·hm−2; N2: 施氮量为150 kg·hm−2; N3: 施氮量为225 kg·hm−2。N0: no N application; N1: N application rate at 75 kg·hm−2; N2: N application rate at 150 kg·hm−2; N3: N application rate at 225 kg·hm−2.Figure 7. Effect of nitrogen application rate on catalase (CAT) activity of dryland potato leaves in 2019 and 20202.4 施氮量对旱地马铃薯叶片脯氨酸(Pro)含量的影响
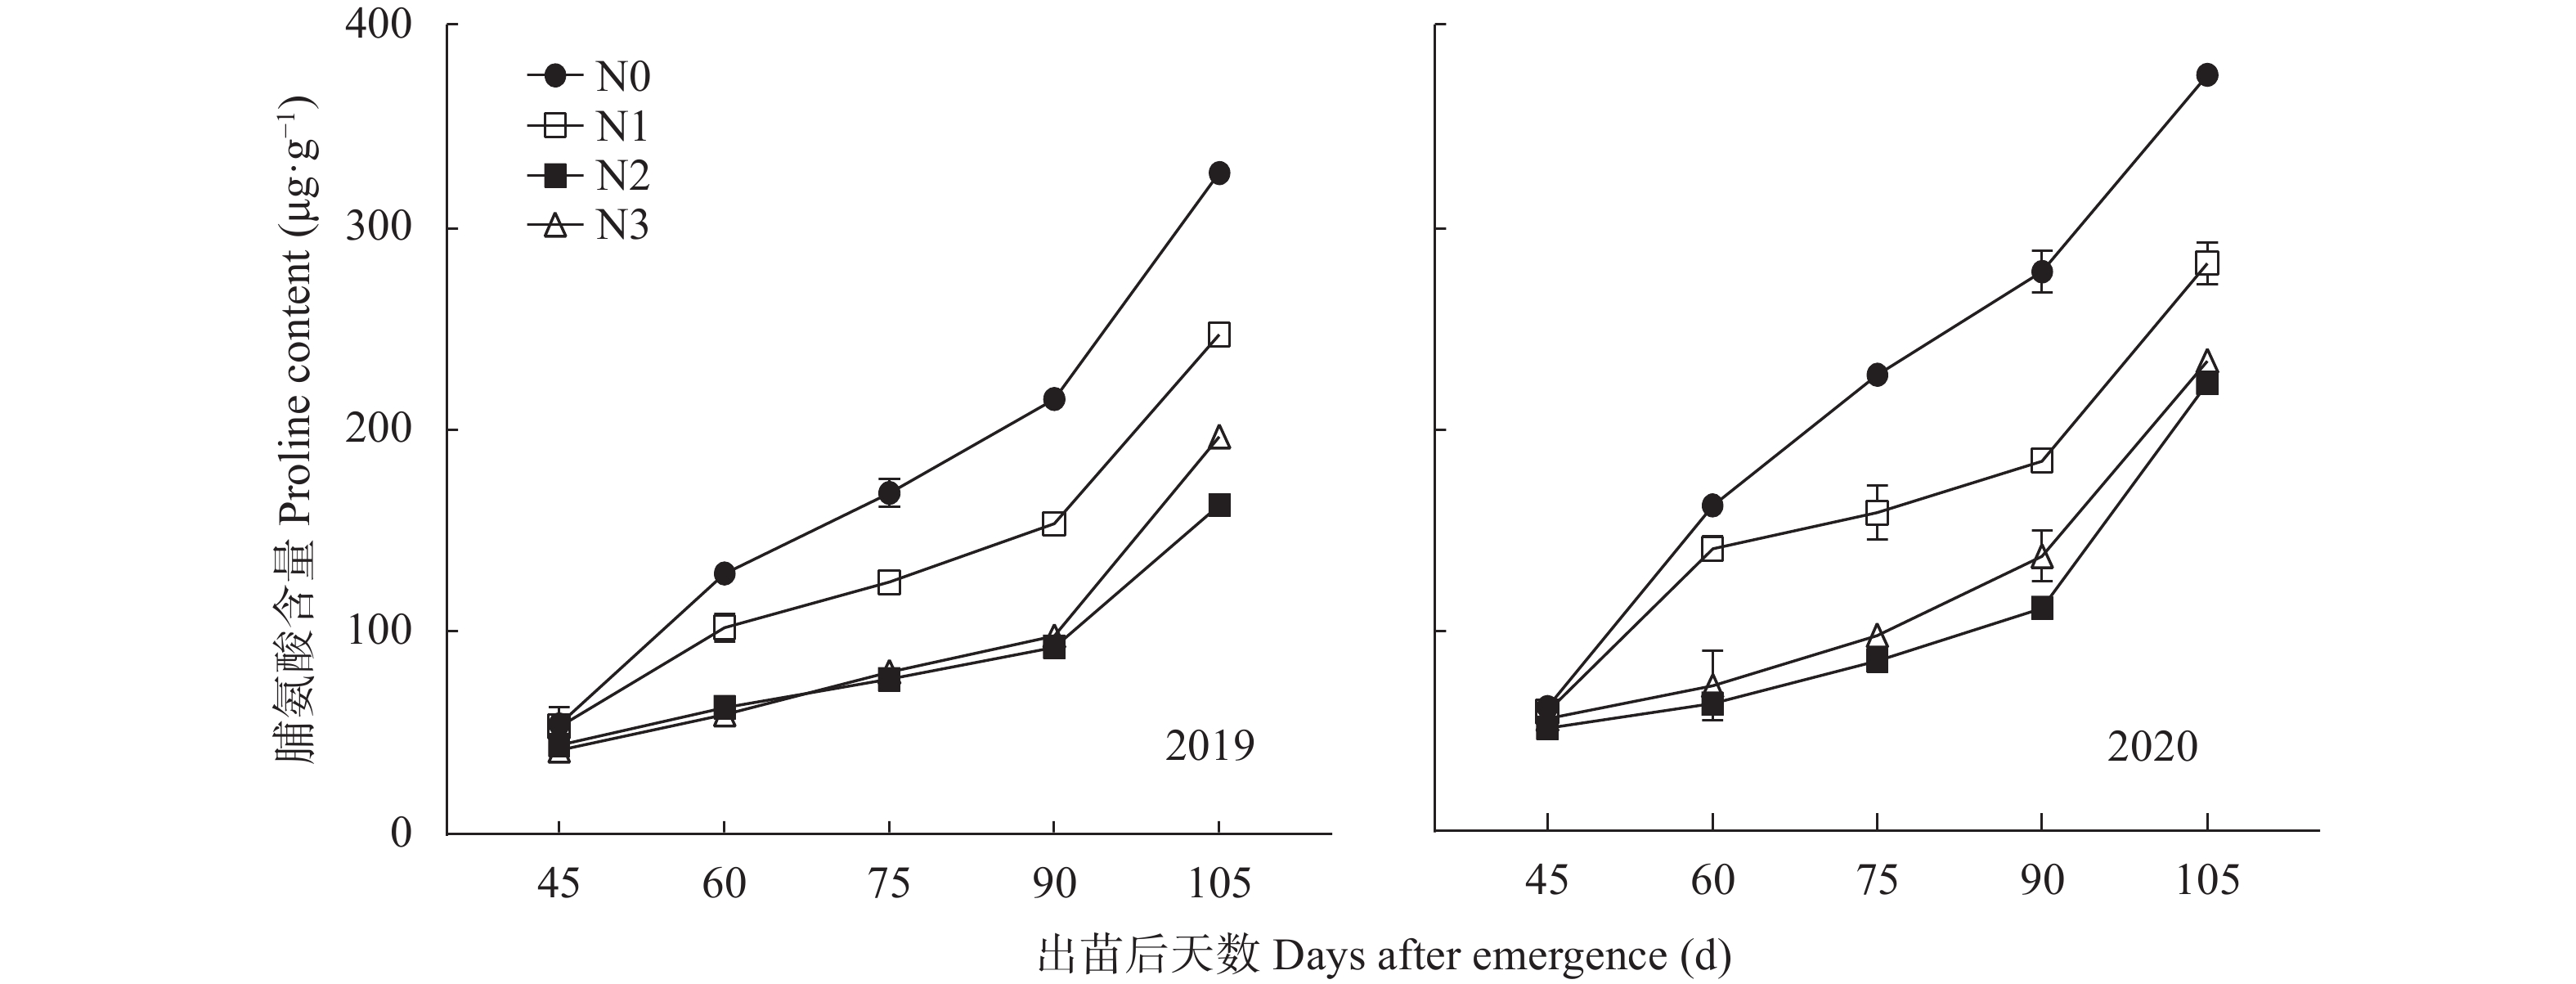
如图8所示, 马铃薯叶片脯氨酸(Pro)含量随其生育进程推进呈增加趋势。与N0相比, 适宜施氮可降低马铃薯叶片Pro含量, 其中施氮量为150 kg·hm−2时, 各时期叶片Pro含量均处于较低水平。出苗后105 d, 2019年N2处理的Pro含量较N0、N1和N3分别显著降低50.31%、34.16%和17.25% (P<0.05), 2020年则显著降低40.84%、21.14%和4.96% (P<0.05), 2020年(平水年)较2019年(丰水年)叶片Pro含量在苗后105 d显著增加, N0、N1、N2和N3处理分别显著提高14.52%、13.83%、36.35%和18.72% (P<0.05)。在本试验条件下, 马铃薯叶片生育后期其自身衰老与当地干旱条件的耦合导致Pro含量急剧上升, 适宜施氮可显著缓解该现象。
![]() 图 8 2019年和2020年施氮量对旱地马铃薯叶片脯氨酸含量的影响N0: 施氮量为0 kg·hm−2; N1: 施氮量为75 kg·hm−2; N2: 施氮量为150 kg·hm−2; N3: 施氮量为225 kg·hm−2。N0: no N application; N1: N application rate at 75 kg·hm−2 ; N2: N application rate at 150 kg·hm−2; N3: N application rate at 225 kg·hm−2.Figure 8. Effect of nitrogen application rate on proline content of dryland potato leaves in 2019 and 2020
图 8 2019年和2020年施氮量对旱地马铃薯叶片脯氨酸含量的影响N0: 施氮量为0 kg·hm−2; N1: 施氮量为75 kg·hm−2; N2: 施氮量为150 kg·hm−2; N3: 施氮量为225 kg·hm−2。N0: no N application; N1: N application rate at 75 kg·hm−2 ; N2: N application rate at 150 kg·hm−2; N3: N application rate at 225 kg·hm−2.Figure 8. Effect of nitrogen application rate on proline content of dryland potato leaves in 2019 and 20202.5 施氮量对旱地马铃薯干物质积累及其动态参数的影响
2.5.1 对干物质积累的影响
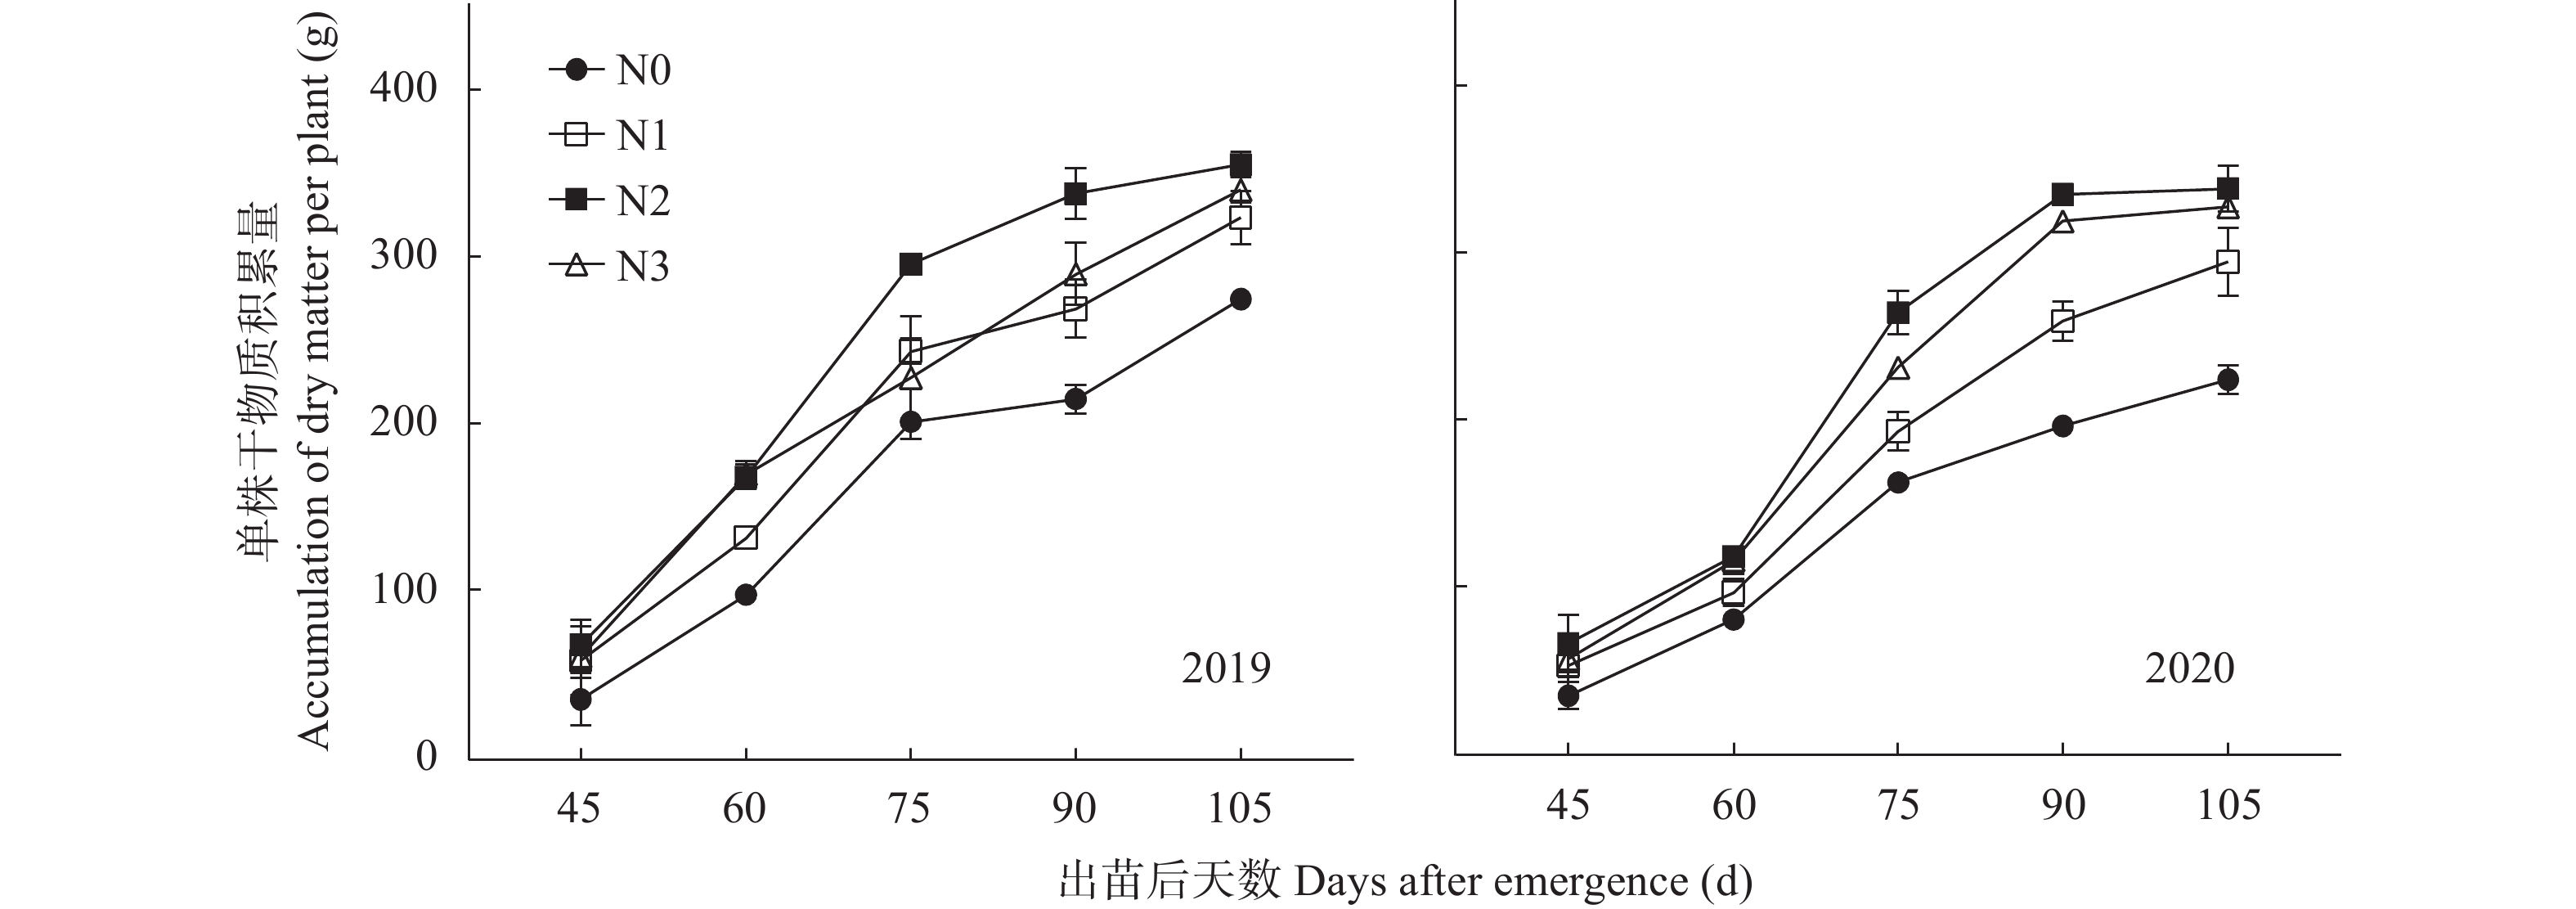
由图9可知, 随马铃薯生育进程推进, 各处理干物质积累量呈递增趋势, 2年均在出苗后105 d达峰值。与N0相比, 合理施氮可显著提高马铃薯干物质积累量, 其中N2处理最优。在苗后105 d, 与N0相比, 2019年N1、N2和N3处理干物质积累量分别显著增高17.68%、29.31%和23.78% (P<0.05), 2020年则显著增加31.65%、51.18%和46.26% (P<0.05)。2020年各施氮处理较N0增加量显著高于2019年(P<0.05)。
![]() 图 9 2019年和2020年施氮量对旱地马铃薯总干物质积累的影响N0: 施氮量为0 kg·hm−2; N1: 施氮量为75 kg·hm−2; N2: 施氮量为150 kg·hm−2; N3: 施氮量为225 kg·hm−2。N0: no N application; N1: N application rate at 75 kg·hm−2; N2: N application rate at 150 kg·hm−2; N3: N application rate at 225 kg·hm−2.Figure 9. Effect of nitrogen application rate on total dry matter accumulation in dryland potatoes in 2019 and 2020
图 9 2019年和2020年施氮量对旱地马铃薯总干物质积累的影响N0: 施氮量为0 kg·hm−2; N1: 施氮量为75 kg·hm−2; N2: 施氮量为150 kg·hm−2; N3: 施氮量为225 kg·hm−2。N0: no N application; N1: N application rate at 75 kg·hm−2; N2: N application rate at 150 kg·hm−2; N3: N application rate at 225 kg·hm−2.Figure 9. Effect of nitrogen application rate on total dry matter accumulation in dryland potatoes in 2019 and 20202.5.2 对干物质积累动态参数的影响
采用Logistic方程模拟马铃薯总干物质积累过程, 通过CurveExpert Professional 2.6.5软件拟合得到各处理Logistic方程特征参数, 决定系数达0.981~0.998 (表2), 能清晰反映其干物质积累进程。2020年, 马铃薯达到最大干物质积累速率时的天数(Tmax)随施氮量提高呈先降后增趋势, 其中N2处理最低, 同时N1、N2和N3处理的Tmax较N0分别提前2.13 d、7.30 d和5.53 d。2020年马铃薯达到最大干物质积累速率时的生长量(Wmax)随施氮量增加呈单峰趋势, 而最大干物质积累速率(Gmax)呈先降后升趋势。与N0相比, N2处理的Wmax和Gmax分别显著增加19.48%和12.79% (P<0.05), 同时马铃薯干物质活跃积累天数(D)和快速生长期(T2−T1) N1、N2和N3处理较N0分别显著延长6.59%~21.09% (P<0.05)和6.62%~21.13% (P<0.05), 其中N1处理表现最佳, N3处理次之。两年变化趋势基本一致。以上表明合理施氮可显著改善马铃薯干物质积累特性。综合比较, 以N2处理综合协调能力表现最佳, 能显著增加达到最大干物质积累速率时的生长量, 提高最大干物质积累速率, 适当延长干物质活跃积累天数。
表 2 2019年和2020年不同施氮水平下马铃薯干物质积累动态参数变化Table 2. Changes in dynamic parameters of dry matter accumulation in potatoes under different nitrogen application rates in 2019 and 2020年份
Year处理
Treatment拟合参数
Fitted parameterR2 干物质积累参数
Dry matter accumulation parametera b c Tmax
(d)Wmax
(kg·hm−2)Gmax
(kg·hm−2·d −1)D
(d)T1
(d)T2
(d)2019 N0 286.10 164.16 0.072 0.994 70.85 143.05 5.15 83.79 52.84 89.62 N1 306.90 63.05 0.059 0.992 70.24 153.45 4.53 101.01 47.59 91.93 N2 357.64 54.75 0.066 0.996 60.65 178.82 5.90 91.60 41.01 81.22 N3 326.58 82.91 0.067 0.986 65.94 163.29 5.47 89.70 46.36 85.73 2020 N0 246.65 135.90 0.071 0.985 69.18 123.33 4.38 84.01 50.34 87.21 N1 268.43 52.24 0.059 0.981 67.05 134.22 3.96 101.73 44.74 89.40 N2 294.70 63.21 0.067 0.997 61.88 147.35 4.94 89.55 42.23 81.54 N3 277.42 58.75 0.064 0.998 63.65 138.71 4.44 93.10 42.77 83.63 N0: 施氮量为0 kg·hm−2; N1: 施氮量为75 kg·hm−2; N2: 施氮量为150 kg·hm−2; N3: 施氮量为225 kg·hm−2。a: 终极生长量; b: 初始参数; c: 生长速率参数; Tmax: 达到最大积累速率的天数; Wmax: 达到最大干物质积累速率时的生长量; Gmax: 最大干物质积累速率; D: 干物质活跃积累天数; T1为快速生长起始期; T2为快速生长结束期。N0: no N application; N1: N application rate at 75 kg·hm−2; N2: N application rate at 150 kg·hm−2; N3: N application rate at 225 kg·hm−2. a: ultimate growth; b: initial value parameter; c: growth rate parameter; Tmax: number of days to reach the maximum accumulation rate; Wmax: growth at maximum rate of dry matter accumulation; Gmax: maximum dry matter accumulation rate; D: number of days of active dry matter accumulation; T1: beginning of rapid growth; T2: end of rapid growth. 2.6 施氮量对旱地马铃薯产量的影响
2.6.1 对产量及其构成的影响
由表3可知, 与N0处理相比, 不同施氮量对旱地马铃薯均有增产作用。随施氮量增加, 大薯数、中薯数和产量总体呈单峰趋势, 以N2处理综合表现最佳, 且处理间差异显著(P<0.05), 其他产量构成差异不显著。2019年不同施氮处理每穴薯重、大薯数、中薯数、大薯率和商品率较N0处理分别提高7.55%~14.15% (P<0.05)、10.10%~18.49% (P<0.05)、10.38%~27.32% (P<0.05)、5.76%~7.48% (P>0.05)和2.21%~3.87% (P>0.05), 增产幅度达8.49%~16.45% (P<0.05)。2年变化趋势吻合, 即施氮处理可以提高马铃薯产量, 其中N2处理效果最佳。此外, 2年试验地降水量差异较大, 这对马铃薯产量的影响也较为突出。
表 3 2019年和2020年施氮量对旱地马铃薯产量及其构成的影响Table 3. Effect of nitrogen application rate on yield and its composition of dryland potato in 2019 and 2020年份
Year项目
Item每穴薯重
Yam weight per hole
(kg)每穴薯块数
Number of potatoes per hole大薯数
Number of large potatoes
per hole中薯数
Number of medium potatoes
per hole小薯数
Number of small potatoes
per hole大薯率
Rate of large potatoes
(%)中薯率
Rate of medium potatoes
(%)小薯率
Rate of small potatoes
(%)商品薯率
Commercial potato rate
(%)产量
Yield
(t·hm−2)2019 N0 1.06±
0.13a8.43±
0.95a2.87±
1.11c1.83±
0.32b3.61±
0.10a69.54±
0.08c20.93±
0.06a9.52±
0.02a90.48±
0.02b37.79±
1.06cN1 1.14±
0.16a8.89±
2.44a3.16±
0.16b2.33±
0.24a2.89±
0.16ab73.56±
0.02b20.37±
0.02a6.07±
0.01b92.49±
0.01ab40.96±
1.42bN2 1.16±
0.23a8.36±
1.93a3.36±
0.69b2.16±
0.04a3.14±
1.18a74.71±
0.03a17.78±
0.02a7.51±
0.01ab93.93±
0.01a43.95±
1.65aN3 1.21±
0.09a8.66±
1.23a3.40±
0.26a2.02±
0.61b3.23±
0.67a73.99±
0.05b19.19±
0.05a6.82±
0.01b93.18±
0.01a43.50±
1.14a2020 N0 0.99±
0.19a7.58±
0.23a3.11±
0.50b1.56±
0.05b2.84±
0.45b72.35±
0.03c15.57±
0.03bc9.10±
0.01a90.91±
0.03b33.88±
1.00dN1 1.05±
0.10a7.51±
1.16a2.73±
0.32c1.78±
0.27b2.99±
1.02a74.82±
0.02b18.09±
0.01ab7.09±
0.01ab92.19±
0.01a36.98±
0.12cN2 1.21±
0.11a7.54±
1.01a3.29±
0.20a2.35±
1.06a2.51±
0.44b77.63±
0.06a19.46±
0.01ab8.19±
0.02b94.33±
0.01a41.12±
0.67aN3 1.09±
0.21a7.41±
0.54a3.26±
0.43a1.84±
0.79b3.06±
0.51a75.33±
0.07a16.70±
0.07a5.67±
0.03ab91.81±
0.02ab39.00±
0.33bANOVA 年份
Year (Y)NS NS NS NS NS NS NS NS NS ** 处理
Treatment (T)NS NS * * NS NS NS NS NS ** 年份×处理
(Y×T)NS NS NS NS NS NS NS NS NS NS N0: 施氮量为0 kg·hm−2; N1: 施氮量为75 kg·hm−2; N2: 施氮量为150 kg·hm−2; N3: 施氮量为225 kg·hm−2。同年同列不同小写字母表示同年不同处理间差异显著(P<0.05)。NS: 不显著; *: P<0.05; **: P<0.01。N0: no N application; N1: N application rate at 75 kg·hm−2; N2: N application rate at 150 kg·hm−2; N3: N application rate at 225 kg·hm−2. Different lowercase letters in the same column in the same year mean significant differences among different treatments. NS: no significant difference; * and ** mean significant differences at P<0.05 and P<0.01 levels, respectively. 2.6.2 对产量回归模拟曲线的影响
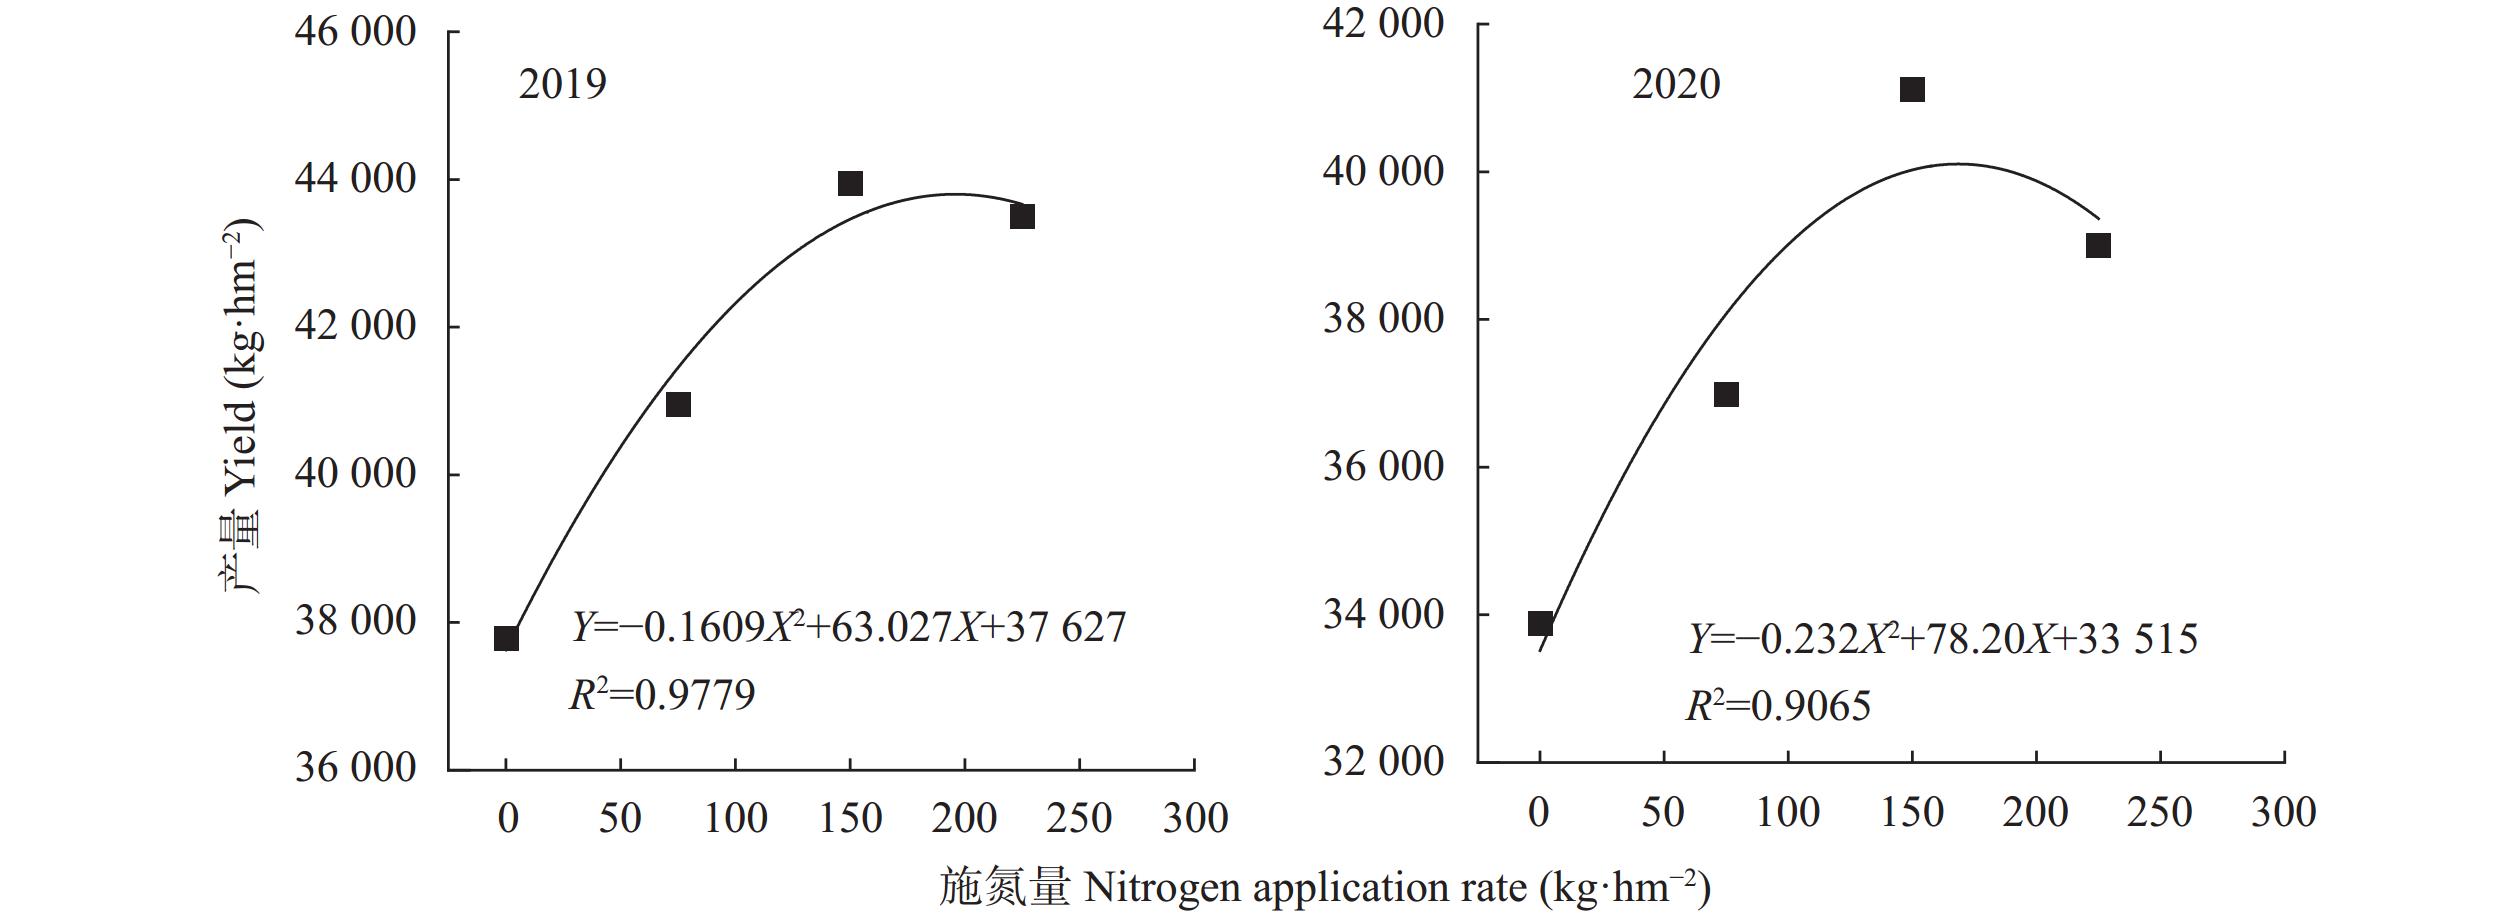
如图10所示, 通过对2019—2020年产量与施氮量进行回归方程拟合发现, 氮肥用量对马铃薯产量的影响均呈二次函数关系且合理施氮有助于马铃薯产量增加, 过量施用会造成其总产量下滑。2019年和2020年施氮量(X)与马铃薯产量(Y)建立的回归方程分别为Y=−0.1609X2+63.027X+37 627, R2=0.9779和Y=−0.232X2+78.20X+33 515, R2=0.9065。当Y'=0时(分别对2个函数求导), X=195.86 kg·hm−2 (2019年)和X=168.53 kg·hm−2 (2020年)可获得最高理论产量(2019年: 43 799.16 kg·hm−2; 2020年: 40 104.70 kg·hm−2)。由此可见, 2019年(丰水年)和2020年(平水年)适宜施氮范围分别为150~196 kg·hm−2和150~169 kg·hm−2 。
![]() 图 10 施氮量对旱地马铃薯产量回归模拟曲线的影响Figure 10. Effect of nitrogen application rate on regression simulation curves of dryland potato yield
图 10 施氮量对旱地马铃薯产量回归模拟曲线的影响Figure 10. Effect of nitrogen application rate on regression simulation curves of dryland potato yield2.7 马铃薯抗氧化参数、干物质积累参数与产量的相互关系
相关性分析表明(表4), 马铃薯产量与最大干物质积累速率(Gmax)呈显著正相关, 与SOD活性、POD活性、CAT活性和干物质活跃积累天数(D)呈极显著正相关, 和MDA、Pro含量呈显著或极显著负相关; 达到最大干物质积累速率的天数(Tmax)与MDA含量呈显著正相关; 达到最大干物质积累速率时的生长量(Wmax)与SOD和POD活性呈显著正相关, 与MDA呈显著负相关; 最大干物质积累速率(Gmax)、干物质活跃积累天数(D)与SOD、CAT和POD活性均呈显著或极显著正相关, 与MDA和Pro含量则为显著或极显著负相关。以上表明在马铃薯各生育期内合理施氮能将叶片维持在一个良好状态, 使其抗氧化酶活性(SOD、POD和CAT)保持在较高水平, 降低MDA和Pro含量, 可优化马铃薯干物质积累特性, 进而显著提高其产量。
表 4 马铃薯抗氧化参数、干物质积累参数与产量的相关性分析Table 4. Correlation analysis of antioxidant parameters, dry matter accumulation parameters and yield of potato项目 Item D Gmax Wmax Tmax Pro MDA CAT POD SOD 产量 Yield 产量 Yield 1.00** 0.98* 0.93 −0.91 −1.00** −0.98* 1.00** 0.99** 0.99** 1.00 SOD 0.97* 0.99* 0.97* −0.94 −0.99* −0.97* 0.98* 0.99* 1.00 POD 1.00** 1.00** 0.96* −0.95 −1.00** −1.00** 1.00** 1.00 CAT 0.99** 0.99* 0.94 −0.93 −1.00** −0.99** 1.00 MDA −0.98* −0.99** −0.96* 0.97* 0.99* 1.00 Pro −1.00** −0.99* −0.96 0.94 1.00 Tmax −0.91 −0.98* −0.98* 1.00 Wmax 0.92 0.98* 1.00 Gmax 0.97* 1.00 D 1.00 *和**分别表示在P<0.05和P<0.01水平显著相关。SOD: 超氧化物歧化酶活性; POD: 过氧化物酶活性; CAT: 过氧化氢酶活性; MDA: 丙二醛含量; Pro: 脯氨酸含量; Tmax: 达到最大干物质积累速率的天数; Wmax: 达到最大干物质积累速率时的生长量; Gmax: 最大干物质积累速率; D: 干物质活跃积累天数。* and ** mean significant correlation at P<0.05 and P<0.01 levels, respectively. SOD: superoxide dismutase activity; POD: peroxidase activity; CAT: catalase activity; MDA: malondialdehyde content; Pro: proline content; Tmax: number of days to reach the maximum dry matter accumulation rate; Wmax: growth at maximum rate of dry matter accumulation; Gmax: maximum dry matter accumulation rate; D: number of days of active dry matter accumulation. 3. 讨论
3.1 适宜施氮量可改善旱地马铃薯叶片抗氧化特性
作物叶片生长、发育和衰老的最直接反映是叶面积指数(LAI), 光合作用中最关键的色素是叶绿素, 当 LAI 和 SPAD 水平较高时, 叶片中叶绿素含量会大大增加[12]。因此, 保持高水平的 SPAD 和 LAI 对作物绿叶面积增加、干物质积累合成以及延衰增产具有积极作用[22-23]。合理的氮肥用量可显著增加作物叶片SPAD和 LAI [24]。本研究发现, 合理施氮可显著增加旱地马铃薯叶片各个生育期内的SPAD和LAI, 延长叶片持绿期, 提高群体光合能力, 优化干物质积累特性, 促进产量形成, 达到延衰增产的目的。此外, 降水量对旱地马铃薯衰老进程等指标也具有不同程度影响。2019—2020年试验地气象资料表明, 2019年马铃薯生育期内降雨量达503.9 mm, 为丰水年份; 2020年降雨量为295.9 mm, 为平水年份。2019年马铃薯各生育期的SPAD和LAI值(105 d的LAI除外)显著高于2020年。可能是由于2020年的相对干旱导致马铃薯生育进程加快, 进而加速其衰老; 或是2019年降水量充裕在一定程度上延缓了生育期进程, 进而延缓其衰老。在马铃薯的生育后期, N2处理的SPAD和LAI值显著高于其他处理。2年结果一致, 即适宜施氮量可显著增加旱地马铃薯的SPAD和LAI, 延缓其生育后期SPAD和LAI的下降, 其中以施氮量150 kg·hm−2效果最佳。
作物生育后期会形成大量自由基, 随后发生自由基连锁反应, 导致膜脂过氧化, 并产生具有细胞毒性的丙二醛(MDA), 进而加速了其衰老, 而SOD、POD和CAT等则是植物体内抵抗膜脂过氧化的保护性酶[10]。在马铃薯生育后期保护酶活性会大幅度降低, 而自由基、活性氧、MDA等物质会大量积累, 导致其细胞膜过氧化、蛋白质变性等多种有害细胞效应, 加剧叶片衰老[25]。此外, 作物生育后期Pro含量增加会提高其对逆境的适应能力, 这是作物的一种自我保护机制[26]。通过优化施氮量满足作物在各时期的氮素需求, 有助于提高作物相应时期的叶绿素含量, 延缓功能叶片衰老, 增加绿叶面积, 增强光合作用, 促进干物质积累合成, 进而促进其产量提升[27-28]。本试验表明, 不施氮处理(N0)在马铃薯各生育期内保护酶活性总体低于施氮处理, 尤其在马铃薯生育后期, 低施氮量给叶片维持高水平抗氧化活性带来巨大挑战。施氮量为150 kg·hm−2可显著提高马铃薯生育后期SOD、POD和CAT活性, 进而有效消除其体内超氧自由基、过氧化氢等有害物质, 保护细胞膜结构的完整性[29]。在本试验条件下, SOD、POD和CAT在马铃薯生育后期呈快速下降趋势, 而MDA和Pro含量则相反, 该现象给生育后期马铃薯产量及产量构成带来不利影响, 而优化施氮水平可以显著缓解该现象。生育后期马铃薯自身逐渐衰老和当地干旱条件(西北干旱地区)导致Pro含量急剧上升, 而适宜施氮量可显著缓解干旱对马铃薯的不利影响, 使得叶片Pro含量下降, 因此, 本试验视Pro含量下降为氮素延缓马铃薯衰老的一种表现。
综上, 适宜施氮量在马铃薯生育前期能快速有效供给养分, 对维持前期功能叶片保护性酶活性具有重要意义, 保障源器官生长发育顺畅, 进而后期方可有效确保库器官养分供给。合理的氮肥用量在马铃薯生长后期可显著提高保护酶活性, 降低MDA和Pro含量进而有效缓解干旱危害。施氮量为150 kg·hm−2 (本研究为N2水平)在上述参数中均有着明显优势, 因此, 本文认为该施氮量对宁夏南部山区旱地马铃薯延衰增产和保源扩库具有重要作用。
3.2 适宜施氮量可优化旱地马铃薯干物质积累及产量形成特性
适宜的氮肥用量可显著提高作物干物质积累速率和积累速率最大时生长量, 延长积累活跃期, 提高其产量, 而过量施用氮肥会导致干物质积累速率下降, 产量严重下滑[30-32]。有研究表明, 干物质积累是产量形成的基本条件, 施氮既可促进作物干物质积累, 又可缓解干旱胁迫带来的危害[19]。张振博等[33]认为适宜施氮量可延长籽粒灌浆活跃期, 增加百粒重, 从而提高产量, 但如果施氮过多, 则会减少开花前茎中非结构性碳水化合物的积累, 阻碍养分向籽粒中转移, 导致植株贪青晚熟, 不利于粒重的增加, 同时降低了作物产量。而在马铃薯生产中, 相关研究表明, 其叶片光合能力增强可有效促进同化物积累并向块茎中进行转运, 为块茎建成提供物质保障[34]。马铃薯块茎形成期、块茎膨大期和淀粉积累期对肥料的需求量较大, 也是其需肥关键时期。此阶段充足的氮素供给可显著提高其叶片光合能力, 进而保障充足的养分供应; 同时有效促进马铃薯块茎形成期库器官的形成, 增加库数量; 有助于块茎膨大期干物质的积累和改善淀粉积累期品质, 最终为其产量和品质双提升提供保障[35]。本研究通过将2年施氮量与马铃薯干物质积累特性相耦合总结得出, 马铃薯总干物质积累参数Gmax和Wmax, N2处理较N0提高显著且优于其他处理, 平均分别提高13.36%和22.24% (P<0.05)。相较于N0处理, N1、N2和N3处理干物质活跃积累天数与快速生长期明显增加, 平均分别延长6.59%~21.09% (P<0.05)和6.62%~21.13% (P<0.05), 以N1处理表现最佳, N3次之。但综合比较, 本研究认为N2处理的综合协调能力最佳, 既能保障马铃薯拥有较高水平的最大干物质积累速率和达到最大干物质积累速率时的生长量, 又能使干物质积累活跃天数和快速生长期维持在一个适宜范围。在产量参数上, 有研究表明, 施氮水平与总产量、大薯数、大薯率以及商品薯率呈显著正相关[36]; 蔡明等[37]的试验结果表明, 施氮量对马铃薯生长指标和产量的贡献效果显著, 一定程度上可以增加马铃薯干物质累积量及累积速率。本研究发现, 氮肥处理间马铃薯产量差异极显著(P<0.01), 其产量随施氮量增加呈单峰趋势, 究其原因, 高施氮量会导致其地上部分在生育后期贪青晚熟或是自身功能器官逐渐衰老, 进而使其产量显著下滑; 产量构成中只有大薯数和中薯数在施氮处理下较不施氮有显著差异(P<0.05), 其他构成均差异不显著,但综合对比仍以N2处理表现最优。还有学者对马铃薯产量进行回归方程拟合, 发现其与施氮量呈二次函数关系[38], 进而得出其最高理论产量和最佳施氮量受不同年份间气温和降水差异影响较大[39]。该结论与本试验结果一致。相关性分析表明, 马铃薯最大干物质积累速率与保护酶活性呈显著或极显著正相关, 与MDA和Pro含量呈显著或极显著负相关。随马铃薯生育后期MDA和Pro积累量增加, 干物质积累速率显著下降; 而保持叶片具有较高水平的保护酶活性, 可显著延缓其干物质积累速率下降, 其中N2处理(施氮量为150 kg·hm−2)在生育后期效果最为显著。此外, 产量与最大干物质积累速率、积累活跃期及保护酶活性呈显著或极显著正相关, 与MDA和Pro含量呈显著或极显著负相关。适宜施氮量可通过提高干物质积累量, 加快干物质积累速率和延缓积累活跃期来调控其干物质积累过程, 并提高生育后期保护性酶活性, 降低膜脂过氧化物含量, 最终达到延衰增产的目的。另外, 针对试验地极端气候(高温、干旱)对马铃薯叶片抗氧化特性、干物质积累特性及产量的影响还需要进行更深层次的研究,进而更有利于当地旱作马铃薯产业达到绿色、高效的生产目标。
4. 结论
与不施氮肥相比, 适宜施氮量可显著增加旱地马铃薯叶面积指数, 提高生育期内相对叶绿素含量和抗氧化酶活性, 降低膜脂过氧化产物(MDA)含量, 进而显著增加功能叶片面积, 延长绿叶期, 提高光合能力, 增加各生育期内干物质积累量, 优化其干物质积累特性, 最终实现产量提升。施氮量为150 kg·hm−2可显著提高旱地马铃薯叶片LAI和SPAD值, 对生育后期维持叶片较高水平的抗氧化酶活性, 抑制膜脂过氧化产物的积累, 延缓叶片衰老具有积极作用。该施氮量对最大干物质积累速率、达到最大干物质积累速率时的生长量和产量的持续优化, 干物质积累活跃期和快速生长期的持续改善均具有显著效果。本文在宁夏南部山区常年干旱条件下, 提出了因地制宜的氮肥运筹方案, 以达到持续优化马铃薯抗氧化特性和改善干物质积累特性的目的, 以上为当地马铃薯绿色高效栽培提供了技术支撑。
-
![]()
图 1 2019—2020年试验地马铃薯生育期月降水量和月均温
Figure 1. Monthly precipitation and mean monthly temperature of the test site during the growth stage of potato from 2019 to 2020
![]()
图 2 2019年和2020年施氮量对旱地马铃薯叶面积指数(LAI)的影响
N0: 施氮量为0 kg·hm−2; N1: 施氮量为75 kg·hm−2; N2: 施氮量为150 kg·hm−2; N3: 施氮量为225 kg·hm−2。N0: no N application; N1: N application rate at 75 kg(N)·hm−2; N2: N application rate at 150 kg(N)·hm−2; N3: N application rate at 225 kg(N)·hm−2.
Figure 2. Effect of nitrogen application rate on leaf area index (LAI) of dryland potatoes in 2019 and 2020
![]()
图 3 2019年和2020年施氮量对旱地马铃薯叶片SPAD值的影响
N0: 施氮量为0 kg·hm−2; N1: 施氮量为75 kg·hm−2; N2: 施氮量为150 kg·hm−2; N3: 施氮量为225 kg·hm−2。N0: no N application; N1: N application rate at 75 kg·hm−2; N2: N application rate at 150 kg·hm−2; N3: N application rate at 225 kg·hm−2.
Figure 3. Effect of nitrogen application rate on SPAD values of dryland potato leaves in 2019 and 2020
![]()
图 4 2019年和2020年施氮量对旱地马铃薯叶片丙二醛(MDA)含量的影响
N0: 施氮量为0 kg·hm−2; N1: 施氮量为75 kg·hm−2; N2: 施氮量为150 kg·hm−2; N3: 施氮量为225 kg·hm−2。N0: no N application; N1: N application rate at 75 kg·hm−2; N2: N application rate at 150 kg·hm−2; N3: N application rate at 225 kg·hm−2.
Figure 4. Effect of nitrogen application rate on malondialdehyde (MDA) content of dryland potato leaves in 2019 and 2020
![]()
图 5 2019年和2020年施氮量对旱地马铃薯叶片超氧化物歧化酶活性(SOD)的影响
N0: 施氮量为0 kg·hm−2; N1: 施氮量为75 kg·hm−2; N2: 施氮量为150 kg·hm−2; N3: 施氮量为225 kg·hm−2。N0: no N application; N1: N application rate at 75 kg·hm−2; N2: N application rate at 150 kg·hm−2; N3: N application rate at 225 kg·hm−2.
Figure 5. Effect of nitrogen application rate on superoxide dismutase (SOD) activity of dryland potato leaves in 2019 and 2020
![]()
图 6 2019年和2020年施氮量对旱地马铃薯叶片过氧化物酶活性(POD)的影响
N0: 施氮量为0 kg·hm−2; N1: 施氮量为75 kg·hm−2; N2: 施氮量为150 kg·hm−2; N3: 施氮量为225 kg·hm−2。N0: no N application; N1: N application rate at 75 kg·hm−2; N2: N application rate at 150 kg·hm−2; N3: N application rate at 225 kg·hm−2.
Figure 6. Effect of nitrogen application rate on peroxidase (POD) activity of dryland potato leaves in 2019 and 2020
![]()
图 7 2019年和2020年施氮量对旱地马铃薯叶片过氧化氢酶活性(CAT)的影响
N0: 施氮量为0 kg·hm−2; N1: 施氮量为75 kg·hm−2; N2: 施氮量为150 kg·hm−2; N3: 施氮量为225 kg·hm−2。N0: no N application; N1: N application rate at 75 kg·hm−2; N2: N application rate at 150 kg·hm−2; N3: N application rate at 225 kg·hm−2.
Figure 7. Effect of nitrogen application rate on catalase (CAT) activity of dryland potato leaves in 2019 and 2020
![]()
图 8 2019年和2020年施氮量对旱地马铃薯叶片脯氨酸含量的影响
N0: 施氮量为0 kg·hm−2; N1: 施氮量为75 kg·hm−2; N2: 施氮量为150 kg·hm−2; N3: 施氮量为225 kg·hm−2。N0: no N application; N1: N application rate at 75 kg·hm−2 ; N2: N application rate at 150 kg·hm−2; N3: N application rate at 225 kg·hm−2.
Figure 8. Effect of nitrogen application rate on proline content of dryland potato leaves in 2019 and 2020
![]()
图 9 2019年和2020年施氮量对旱地马铃薯总干物质积累的影响
N0: 施氮量为0 kg·hm−2; N1: 施氮量为75 kg·hm−2; N2: 施氮量为150 kg·hm−2; N3: 施氮量为225 kg·hm−2。N0: no N application; N1: N application rate at 75 kg·hm−2; N2: N application rate at 150 kg·hm−2; N3: N application rate at 225 kg·hm−2.
Figure 9. Effect of nitrogen application rate on total dry matter accumulation in dryland potatoes in 2019 and 2020
![]()
图 10 施氮量对旱地马铃薯产量回归模拟曲线的影响
Figure 10. Effect of nitrogen application rate on regression simulation curves of dryland potato yield
表 1 土壤基础肥力水平
Table 1 Basic fertility level of tested soil
年份
YearpH 有机质
Organic matter
(g·kg−1)全氮
Total N
(g·kg−1)全磷
Total P
(g·kg−1)碱解氮
Alkali-hydrolyzed nitrogen
(mg·kg−1)速效磷
Available P
(mg·kg−1)速效钾
Available K
(mg·kg−1)2019 8.08 12.09 0.95 0.68 58.79 50.28 168.58 2020 7.45 10.08 0.88 0.68 37.22 28.34 189.03  下载: 导出CSV
表 2 2019年和2020年不同施氮水平下马铃薯干物质积累动态参数变化
Table 2 Changes in dynamic parameters of dry matter accumulation in potatoes under different nitrogen application rates in 2019 and 2020
年份
Year处理
Treatment拟合参数
Fitted parameterR2 干物质积累参数
Dry matter accumulation parametera b c Tmax
(d)Wmax
(kg·hm−2)Gmax
(kg·hm−2·d −1)D
(d)T1
(d)T2
(d)2019 N0 286.10 164.16 0.072 0.994 70.85 143.05 5.15 83.79 52.84 89.62 N1 306.90 63.05 0.059 0.992 70.24 153.45 4.53 101.01 47.59 91.93 N2 357.64 54.75 0.066 0.996 60.65 178.82 5.90 91.60 41.01 81.22 N3 326.58 82.91 0.067 0.986 65.94 163.29 5.47 89.70 46.36 85.73 2020 N0 246.65 135.90 0.071 0.985 69.18 123.33 4.38 84.01 50.34 87.21 N1 268.43 52.24 0.059 0.981 67.05 134.22 3.96 101.73 44.74 89.40 N2 294.70 63.21 0.067 0.997 61.88 147.35 4.94 89.55 42.23 81.54 N3 277.42 58.75 0.064 0.998 63.65 138.71 4.44 93.10 42.77 83.63 N0: 施氮量为0 kg·hm−2; N1: 施氮量为75 kg·hm−2; N2: 施氮量为150 kg·hm−2; N3: 施氮量为225 kg·hm−2。a: 终极生长量; b: 初始参数; c: 生长速率参数; Tmax: 达到最大积累速率的天数; Wmax: 达到最大干物质积累速率时的生长量; Gmax: 最大干物质积累速率; D: 干物质活跃积累天数; T1为快速生长起始期; T2为快速生长结束期。N0: no N application; N1: N application rate at 75 kg·hm−2; N2: N application rate at 150 kg·hm−2; N3: N application rate at 225 kg·hm−2. a: ultimate growth; b: initial value parameter; c: growth rate parameter; Tmax: number of days to reach the maximum accumulation rate; Wmax: growth at maximum rate of dry matter accumulation; Gmax: maximum dry matter accumulation rate; D: number of days of active dry matter accumulation; T1: beginning of rapid growth; T2: end of rapid growth.
下载: 导出CSV
表 3 2019年和2020年施氮量对旱地马铃薯产量及其构成的影响
Table 3 Effect of nitrogen application rate on yield and its composition of dryland potato in 2019 and 2020
年份
Year项目
Item每穴薯重
Yam weight per hole
(kg)每穴薯块数
Number of potatoes per hole大薯数
Number of large potatoes
per hole中薯数
Number of medium potatoes
per hole小薯数
Number of small potatoes
per hole大薯率
Rate of large potatoes
(%)中薯率
Rate of medium potatoes
(%)小薯率
Rate of small potatoes
(%)商品薯率
Commercial potato rate
(%)产量
Yield
(t·hm−2)2019 N0 1.06±
0.13a8.43±
0.95a2.87±
1.11c1.83±
0.32b3.61±
0.10a69.54±
0.08c20.93±
0.06a9.52±
0.02a90.48±
0.02b37.79±
1.06cN1 1.14±
0.16a8.89±
2.44a3.16±
0.16b2.33±
0.24a2.89±
0.16ab73.56±
0.02b20.37±
0.02a6.07±
0.01b92.49±
0.01ab40.96±
1.42bN2 1.16±
0.23a8.36±
1.93a3.36±
0.69b2.16±
0.04a3.14±
1.18a74.71±
0.03a17.78±
0.02a7.51±
0.01ab93.93±
0.01a43.95±
1.65aN3 1.21±
0.09a8.66±
1.23a3.40±
0.26a2.02±
0.61b3.23±
0.67a73.99±
0.05b19.19±
0.05a6.82±
0.01b93.18±
0.01a43.50±
1.14a2020 N0 0.99±
0.19a7.58±
0.23a3.11±
0.50b1.56±
0.05b2.84±
0.45b72.35±
0.03c15.57±
0.03bc9.10±
0.01a90.91±
0.03b33.88±
1.00dN1 1.05±
0.10a7.51±
1.16a2.73±
0.32c1.78±
0.27b2.99±
1.02a74.82±
0.02b18.09±
0.01ab7.09±
0.01ab92.19±
0.01a36.98±
0.12cN2 1.21±
0.11a7.54±
1.01a3.29±
0.20a2.35±
1.06a2.51±
0.44b77.63±
0.06a19.46±
0.01ab8.19±
0.02b94.33±
0.01a41.12±
0.67aN3 1.09±
0.21a7.41±
0.54a3.26±
0.43a1.84±
0.79b3.06±
0.51a75.33±
0.07a16.70±
0.07a5.67±
0.03ab91.81±
0.02ab39.00±
0.33bANOVA 年份
Year (Y)NS NS NS NS NS NS NS NS NS ** 处理
Treatment (T)NS NS * * NS NS NS NS NS ** 年份×处理
(Y×T)NS NS NS NS NS NS NS NS NS NS N0: 施氮量为0 kg·hm−2; N1: 施氮量为75 kg·hm−2; N2: 施氮量为150 kg·hm−2; N3: 施氮量为225 kg·hm−2。同年同列不同小写字母表示同年不同处理间差异显著(P<0.05)。NS: 不显著; *: P<0.05; **: P<0.01。N0: no N application; N1: N application rate at 75 kg·hm−2; N2: N application rate at 150 kg·hm−2; N3: N application rate at 225 kg·hm−2. Different lowercase letters in the same column in the same year mean significant differences among different treatments. NS: no significant difference; * and ** mean significant differences at P<0.05 and P<0.01 levels, respectively.
下载: 导出CSV
表 4 马铃薯抗氧化参数、干物质积累参数与产量的相关性分析
Table 4 Correlation analysis of antioxidant parameters, dry matter accumulation parameters and yield of potato
项目 Item D Gmax Wmax Tmax Pro MDA CAT POD SOD 产量 Yield 产量 Yield 1.00** 0.98* 0.93 −0.91 −1.00** −0.98* 1.00** 0.99** 0.99** 1.00 SOD 0.97* 0.99* 0.97* −0.94 −0.99* −0.97* 0.98* 0.99* 1.00 POD 1.00** 1.00** 0.96* −0.95 −1.00** −1.00** 1.00** 1.00 CAT 0.99** 0.99* 0.94 −0.93 −1.00** −0.99** 1.00 MDA −0.98* −0.99** −0.96* 0.97* 0.99* 1.00 Pro −1.00** −0.99* −0.96 0.94 1.00 Tmax −0.91 −0.98* −0.98* 1.00 Wmax 0.92 0.98* 1.00 Gmax 0.97* 1.00 D 1.00 *和**分别表示在P<0.05和P<0.01水平显著相关。SOD: 超氧化物歧化酶活性; POD: 过氧化物酶活性; CAT: 过氧化氢酶活性; MDA: 丙二醛含量; Pro: 脯氨酸含量; Tmax: 达到最大干物质积累速率的天数; Wmax: 达到最大干物质积累速率时的生长量; Gmax: 最大干物质积累速率; D: 干物质活跃积累天数。* and ** mean significant correlation at P<0.05 and P<0.01 levels, respectively. SOD: superoxide dismutase activity; POD: peroxidase activity; CAT: catalase activity; MDA: malondialdehyde content; Pro: proline content; Tmax: number of days to reach the maximum dry matter accumulation rate; Wmax: growth at maximum rate of dry matter accumulation; Gmax: maximum dry matter accumulation rate; D: number of days of active dry matter accumulation.
下载: 导出CSV
-
[1] 李亚红, 霍超, 曹继芬, 等. 云南省不同季节马铃薯晚疫病发生流行及侵染规律[J]. 西南农业学报, 2022, 35(9): 2046−2053 LI Y H, HUO C, CAO J F, et al. Epidemics and infection characteristics of potato late blight in different seasons in Yunnan Province[J]. Southwest China Journal of Agricultural Sciences, 2022, 35(9): 2046−2053
[2] 王金秋, 武舜臣. 马铃薯主粮化战略的动力、障碍与前景[J]. 农业经济, 2018(4): 17−19 doi: 10.3969/j.issn.1001-6139.2018.04.006 WANG J Q, WU S C. Motivation, obstacles and prospects of potato staple food strategy[J]. Agricultural Economy, 2018(4): 17−19 doi: 10.3969/j.issn.1001-6139.2018.04.006
[3] 孙爽, 王春乙, 宋艳玲, 等. 我国北方一作区马铃薯高产稳产区分布特征[J]. 应用气象学报, 2021, 32(4): 385−396 doi: 10.11898/1001-7313.20210401 SUN S, WANG C Y, SONG Y L, et al. Distributions of high and stable yield zones for potato in the single-cropping region in northern China[J]. Journal of Applied Meteorological Science, 2021, 32(4): 385−396 doi: 10.11898/1001-7313.20210401
[4] 余凯凯, 宋喜娥, 高虹, 等. 不同施肥水平下多效唑对马铃薯光合及叶绿素荧光参数的影响[J]. 核农学报, 2016, 30(1): 154−163 doi: 10.11869/j.issn.100-8551.2016.01.0154 YU K K, SONG X E, GAO H, et al. Effect of paclobutrazol on photosynthesis and chlorophyll fluorescence under different fertilization rates in potatoes[J]. Journal of Nuclear Agricultural Sciences, 2016, 30(1): 154−163 doi: 10.11869/j.issn.100-8551.2016.01.0154
[5] 杨淑华, 王台, 钱前, 等. 2015年中国植物科学若干领域重要研究进展[J]. 植物学报, 2016, 51(4): 416−472 doi: 10.11983/CBB16160 YANG S H, WANG T, QIAN Q, et al. Research advances on plant science in China in 2015[J]. Chinese Bulletin of Botany, 2016, 51(4): 416−472 doi: 10.11983/CBB16160
[6] 廖娜, 侯振安, 李琦, 等. 不同施氮水平下生物碳提高棉花产量及氮肥利用率的作用[J]. 植物营养与肥料学报, 2015, 21(3): 782−791 doi: 10.11674/zwyf.2015.0326 LIAO N, HOU Z A, LI Q, et al. Increase effect of biochar on cotton yield and nitrogen use efficiency under different nitrogen application levels[J]. Journal of Plant Nutrition and Fertilizer, 2015, 21(3): 782−791 doi: 10.11674/zwyf.2015.0326
[7] 庄振东, 李絮花. 腐植酸氮肥对玉米产量、氮肥利用及氮肥损失的影响[J]. 植物营养与肥料学报, 2016, 22(5): 1232−1239 doi: 10.11674/zwyf.15512 ZHUANG Z D, LI X H. Effects of humic acid nitrogen fertilization on corn yield, nitrogen utilization and nitrogen loss[J]. Journal of Plant Nutrition and Fertilizer, 2016, 22(5): 1232−1239 doi: 10.11674/zwyf.15512
[8] 熊正琴, 张晓旭. 氮肥高效施用在低碳农业中的关键作用[J]. 植物营养与肥料学报, 2017, 23(6): 1433−1440 doi: 10.11674/zwyf.17282 XIONG Z Q, ZHANG X X. Key role of efficient nitrogen application in low carbon agriculture[J]. Journal of Plant Nutrition and Fertilizer, 2017, 23(6): 1433−1440 doi: 10.11674/zwyf.17282
[9] 石洪亮, 严青青, 张巨松, 等. 氮肥对非充分灌溉下棉花花铃期光合特性及产量的补偿作用[J]. 作物学报, 2018, 44(8): 1196−1204 doi: 10.3724/SP.J.1006.2018.01196 SHI H L, YAN Q Q, ZHANG J S, et al. Compensation effect of nitrogen fertilizer on photosynthetic characteristics and yield during cotton flowering boll-setting stage under non-sufficient drip irrigation[J]. Acta Agronomica Sinica, 2018, 44(8): 1196−1204 doi: 10.3724/SP.J.1006.2018.01196
[10] 于浩东, 初振宇, 汪顺源, 等. 不同控释氮素比例对夏玉米叶片衰老和籽粒灌浆特性的影响[J]. 中国农业科学, 2023, 56(18): 3511−3529 doi: 10.3864/j.issn.0578-1752.2023.18.003 YU H D, CHU Z Y, WANG S Y, et al. Effects of different controlled nitrogen ratios on leaf senescence and grain filling characteristics of summer maize[J]. Scientia Agricultura Sinica, 2023, 56(18): 3511−3529 doi: 10.3864/j.issn.0578-1752.2023.18.003
[11] 王英, 刘汝亮, 王芳, 等. 减氮对引黄灌区春玉米氮素吸收利用和淋失的影响[J]. 农业资源与环境学报, 2024, 41(3): 576–584 WANG Y, LIU R L, WANG F, et al. Effects of nitrogen reduction on nitrogen uptake, utilization and leaching of spring maize in the yellow-irrigation area[J]. Journal of Agricultural Resources and Environment, 2024, 41(3): 576–584
[12] 徐玉坤, 薛龙飞. 不同施肥模式对马铃薯光合特性及产量品质的影响[J]. 中国农业大学学报, 2022, 27(6): 83−90 XU Y K, XUE L F. Effects of different fertilization models on the photosynthetic characteristics, yield and quality of potato[J]. Journal of China Agricultural University, 2022, 27(6): 83−90
[13] 王西亚, 盛寅生, 何萍, 等. 我国马铃薯施肥现状与减肥潜力[J]. 植物营养与肥料学报, 2023, 29(11): 2059−2070 doi: 10.11674/zwyf.2023137 WANG X Y, SHENG Y S, HE P, et al. Current situation and reduction potential of potato fertilization in China[J]. Journal of Plant Nutrition and Fertilizers, 2023, 29(11): 2059−2070 doi: 10.11674/zwyf.2023137
[14] 魏千贺, 王晨, 范春梅, 等. 马铃薯种植灌溉方式及施肥研究进展综述[J]. 江苏农业科学, 2018, 46(24): 20−23 WEI Q H, WANG C, FAN C M, et al. Research progress of planting, irrigation and fertilization of potato: a review[J]. Jiangsu Agricultural Sciences, 2018, 46(24): 20−23
[15] 何万春, 何昌福, 邱慧珍, 等. 不同氮水平对旱地覆膜马铃薯干物质积累与分配的影响[J]. 干旱地区农业研究, 2016, 34(4): 175−182 doi: 10.7606/j.issn.1000-7601.2016.04.27 HE W C, HE C F, QIU H Z, et al. Effects of nitrogen rates on dry matter accumulation and distribution of potato plants under film mulching in dry land[J]. Agricultural Research in the Arid Areas, 2016, 34(4): 175−182 doi: 10.7606/j.issn.1000-7601.2016.04.27
[16] 张姚, 程宏波, 杨佳佳, 等. 覆盖方式对旱地小麦花后旗叶抗氧化生理及粒重形成的影响[J]. 干旱地区农业研究, 2023, 41(4): 141−150 ZHANG Y, CHENG H B, YANG J J, et al. Effect of mulching methods on drought resistance physiology and grain weight formation of dryland wheat in post-flowering flag leaf[J]. Agricultural Research in the Arid Areas, 2023, 41(4): 141−150
[17] 闫东良, 何灵芝, 李欢, 等. 控释尿素和普通尿素配比对不同氮效率玉米叶片衰老特性和土壤酶活性的影响[J]. 生态学报, 2021, 41(23): 9410−9421 YAN D L, HE L Z, LI H, et al. Effects of combination of controlled release urea and normal urea on the leaf senescence and soil enzyme activity of different maize cultivars[J]. Acta Ecologica Sinica, 2021, 41(23): 9410−9421
[18] 李广浩, 刘平平, 赵斌, 等. 不同水分条件下控释尿素对夏玉米产量和叶片衰老特性的影响[J]. 应用生态学报, 2017, 28(2): 571−580 LI G H, LIU P P, ZHAO B, et al. Effects of water conditions and controlled release urea on yield and leaf senescence physiological characteristics in summer maize[J]. Chinese Journal of Applied Ecology, 2017, 28(2): 571−580
[19] 班文慧, 王星强, 柳强娟, 等. 施氮对块茎形成期高温胁迫后马铃薯块茎产量、淀粉含量和相关酶代谢活性的影响[J]. 核农学报, 2022, 36(2): 422−434 doi: 10.11869/j.issn.100-8551.2022.02.0422 BAN W H, WANG X Q, LIU Q J, et al. Effects of nitrogen application rate on potato yield, starch content and related enzyme metabolic during tuber formation after high temperature stress[J]. Journal of Nuclear Agricultural Sciences, 2022, 36(2): 422−434 doi: 10.11869/j.issn.100-8551.2022.02.0422
[20] 孙群, 胡景江. 植物生理学研究技术[M]. 杨凌: 西北农林科技大学出版社, 2006 SUN Q, HU J J. Research Technology of Plant Physiology[M]. Yangling: Northwest A&F University Press, 2006
[21] 吕文河, 马子竣, 李莹, 等. 马铃薯4x-4x和4x-2x杂种后代高世代选系总产和商品薯产量比较[J]. 东北农业大学学报, 2014, 45(10): 1−9 doi: 10.3969/j.issn.1005-9369.2014.10.001 LV W H, MA Z J, LI Y, et al. Comparison for total and marketable tuber yield of advanced clones selected from potato 4x-4x and 4x-2x crosses[J]. Journal of Northeast Agricultural University, 2014, 45(10): 1−9 doi: 10.3969/j.issn.1005-9369.2014.10.001
[22] LI Y L, CHEN P, FU Z D, et al. Maize–soybean relay cropping increases soybean yield synergistically by extending the post-anthesis leaf stay-green period and accelerating grain filling[J]. The Crop Journal, 2023, 11(6): 1921−1930 doi: 10.1016/j.cj.2023.05.011
[23] TANG Y L, GUO J M, JAGADISH S V K, et al. Ovary abortion in field-grown maize under water-deficit conditions is determined by photo-assimilation supply[J]. Field Crops Research, 2023, 293: 108830 doi: 10.1016/j.fcr.2023.108830
[24] 廖若星, 胡云, 蒲甜, 等. 密度与氮素互作对带状套作玉米产量的影响[J]. 中国农业大学学报, 2023, 28(12): 25−38 doi: 10.11841/j.issn.1007-4333.2023.12.03 LIAO R X, HU Y, PU T, et al. Effect of density and nitrogen interaction on the yield of maize in maize-soybean relay strip intercropping[J]. Journal of China Agricultural University, 2023, 28(12): 25−38 doi: 10.11841/j.issn.1007-4333.2023.12.03
[25] 王星强. 花后高温胁迫对旱区马铃薯早衰的响应机理研究[D]. 银川: 宁夏大学, 2022 WANG X Q. Study on response mechanism of post-anthesis high temperature stress to early senescence of potato in arid area[D]. Yinchuan: Ningxia University, 2022
[26] 冯朋博, 慕宇, 孙建波, 等. 高温对马铃薯块茎形成期光合及抗氧化特性的影响[J]. 生态学杂志, 2019, 38(9): 2719−2726 FENG P B, MU Y, SUN J B, et al. Effects of high temperature on potato photosynthetic and antioxidant properties during tuber formation period[J]. Chinese Journal of Ecology, 2019, 38(9): 2719−2726
[27] 田露, 苏文斌, 郭晓霞, 等. 氮肥基追比例对苏打盐碱土甜菜光合效率及糖产量的调控[J]. 植物营养与肥料学报, 2023, 29(7): 1352−1366 doi: 10.11674/zwyf.2022673 TIAN L, SU W B, GUO X X, et al. Optimum basal and topdressing ratios of nitrogen fertilizer for high photosynthetic efficiency and sugar yield of sugar beet in soda alkali-saline farmland[J]. Journal of Plant Nutrition and Fertilizers, 2023, 29(7): 1352−1366 doi: 10.11674/zwyf.2022673
[28] 党科, 宫香伟, 吕思明, 等. 糜子/绿豆间作模式下施氮量对绿豆叶片光合特性及产量的影响[J]. 作物学报, 2021, 47(6): 1175−1187 DANG K, GONG X W, LYU S M, et al. Effects of nitrogen application rate on photosynthetic characteristics and yield of mung bean under the proso millet and mung bean intercropping[J]. Acta Agronomica Sinica, 2021, 47(6): 1175−1187
[29] 杨娜娜, 吴娜, 刘吉利, 等. 间作模式对马铃薯叶片保护酶活性及产量的影响[J]. 干旱地区农业研究, 2019, 37(6): 138−144 doi: 10.7606/j.issn.1000-7601.2019.06.20 YANG N N, WU N, LIU J L, et al. Effects of different intercropping patterns on protective enzyme activities in leaves and yield of potato[J]. Agricultural Research in the Arid Areas, 2019, 37(6): 138−144 doi: 10.7606/j.issn.1000-7601.2019.06.20
[30] 李澳旗, 张俊, 崔晓路, 等. 不同灌水量下尿素添加适宜氮肥增效剂促进夏玉米灌浆增产[J]. 农业工程学报, 2023, 39(16): 99−110 doi: 10.11975/j.issn.1002-6819.202304028 LI A Q, ZHANG J, CUI X L, et al. Nitrogen fertilizer synergist in urea under irrigation for high yield of summer maize at the filling stage[J]. Transactions of the Chinese Society of Agricultural Engineering, 2023, 39(16): 99−110 doi: 10.11975/j.issn.1002-6819.202304028
[31] 刘雨涵, 陈杨, 李海港, 等. 施氮量对不同品种苜蓿结瘤固氮和产量及粗蛋白含量的调控[J]. 中国土壤与肥料, 2023: 1–19. https://link.cnki.net/urlid/11.5498.S.20231218.1821.006 LIU Y H, CHEN Y, LI H G, et al. Regulation of nitrogen fixation and yield and crude protein content by nitrogen application in different varieties of alfalfa[J]. China Soil and Fertilizer, 2023: 1–19. https://link.cnki.net/urlid/11.5498.S.20231218.1821.006
[32] 袁晓婷, 王甜, 罗凯, 等. 带宽和株距对带状间作大豆物质积累分配及产量形成的影响[J]. 作物学报, 2024, 50(1): 161−171 YUAN X T, WANG T, LUO K, et al. Effects of bandwidth and plant spacing on biomass accumulation and allocation and yield formation in strip intercropping soybean[J]. Acta Agronomica Sinica, 2024, 50(1): 161−171
[33] 张振博, 屈馨月, 于宁宁, 等. 施氮量对夏玉米籽粒灌浆特性和内源激素作用的影响[J]. 作物学报, 2022, 48(9): 2366−2376 ZHANG Z B, QU X Y, YU N N, et al. Effects of nitrogen application rate on grain filling characteristics and endogenous hormones in summer maize[J]. Acta Agronomica Sinica, 2022, 48(9): 2366−2376
[34] 郝凯, 贾立国, 秦永林, 等. 氮素对马铃薯源-库关系影响研究进展[J]. 作物杂志, 2020(3): 22−26 HAO K, JIA L G, QIN Y L, et al. Research progress about nitrogen effects on potato source-sink relationship[J]. Crops, 2020(3): 22−26
[35] 闫文渊, 秦军红, 段绍光, 等. 水氮耦合对马铃薯光合特性、块茎形成和品质的影响[J]. 园艺学报, 2022, 49(7): 1491−1504 YAN W Y, QIN J H, DUAN S G, et al. The effect of water-nitrogen coupling on potato photosynthesis, tuber formation and quality[J]. Acta Horticulturae Sinica, 2022, 49(7): 1491−1504
[36] 蔡明, 刘吉利, 杨亚亚, 等. 施氮量对间作马铃薯植株氮素累积及产量的影响[J]. 干旱地区农业研究, 2020, 38(2): 142−149 doi: 10.7606/j.issn.1000-7601.2020.02.20 CAI M, LIU J L, YANG Y Y, et al. Effects of nitrogen application rate on nitrogen accumulation and yield of intercropping potato plants[J]. Agricultural Research in the Arid Areas, 2020, 38(2): 142−149 doi: 10.7606/j.issn.1000-7601.2020.02.20
[37] 蔡明, 贺锦红, 杨亚亚, 等. 宁南山区种植模式和施氮量对马铃薯农艺性状及产量的影响[J]. 华北农学报, 2020, 35(1): 158−167 doi: 10.7668/hbnxb.20190187 CAI M, HE J H, YANG Y Y, et al. Effects of planting patterns and nitrogen application rates on agronomic traits and yield of potato in mountainous areas of southern Ningxia[J]. Acta Agriculturae Boreali-Sinica, 2020, 35(1): 158−167 doi: 10.7668/hbnxb.20190187
[38] YANG K J, WANG F X, SHOCK C C, et al. Potato performance as influenced by the proportion of wetted soil volume and nitrogen under drip irrigation with plastic mulch[J]. Agricultural Water Management, 2017, 179: 260−270 doi: 10.1016/j.agwat.2016.04.014
[39] 柳强娟, 康建宏, 吴佳瑞, 等. 施氮量对宁夏旱区马铃薯块茎淀粉形成和产量的影响[J]. 核农学报, 2021, 35(5): 1196−1208 doi: 10.11869/j.issn.100-8551.2021.05.1196 LIU Q J, KANG J H, WU J R, et al. Effects of nitrogen application amount on formation and yield of potato tuber starch in Ningxia arid region[J]. Journal of Nuclear Agricultural Sciences, 2021, 35(5): 1196−1208 doi: 10.11869/j.issn.100-8551.2021.05.1196
-
期刊类型引用(3)
1. 张瑜. 人形机器人赋能乡村振兴的前景、困境及治理路径. 唐都学刊. 2025(01): 29-36 .  百度学术
百度学术
2. 苏明,李翻过,洪自强,周甜,柳强娟,班文慧,吴宏亮,康建宏. 施氮缓解旱地马铃薯花后高温早衰的抗氧化特性研究. 中国农业科学. 2025(04): 660-675 . 百度学术
3. 苏明,柳强娟,洪自强,李翻过,张正珍,周甜,马纪龙,吴宏亮,康建宏. 西北半干旱区不同施氮量对马铃薯光合特性及产量形成的影响. 植物营养与肥料学报. 2024(10): 1919-1933 . 百度学术
其他类型引用(0)


计量
- 文章访问数: 327
- HTML全文浏览量: 103
- PDF下载量: 103
- 被引次数: 3
