Evaluation of agricultural carbon emissions in Xinjiang and analysis of driving factors based on machine learning algorithms
-
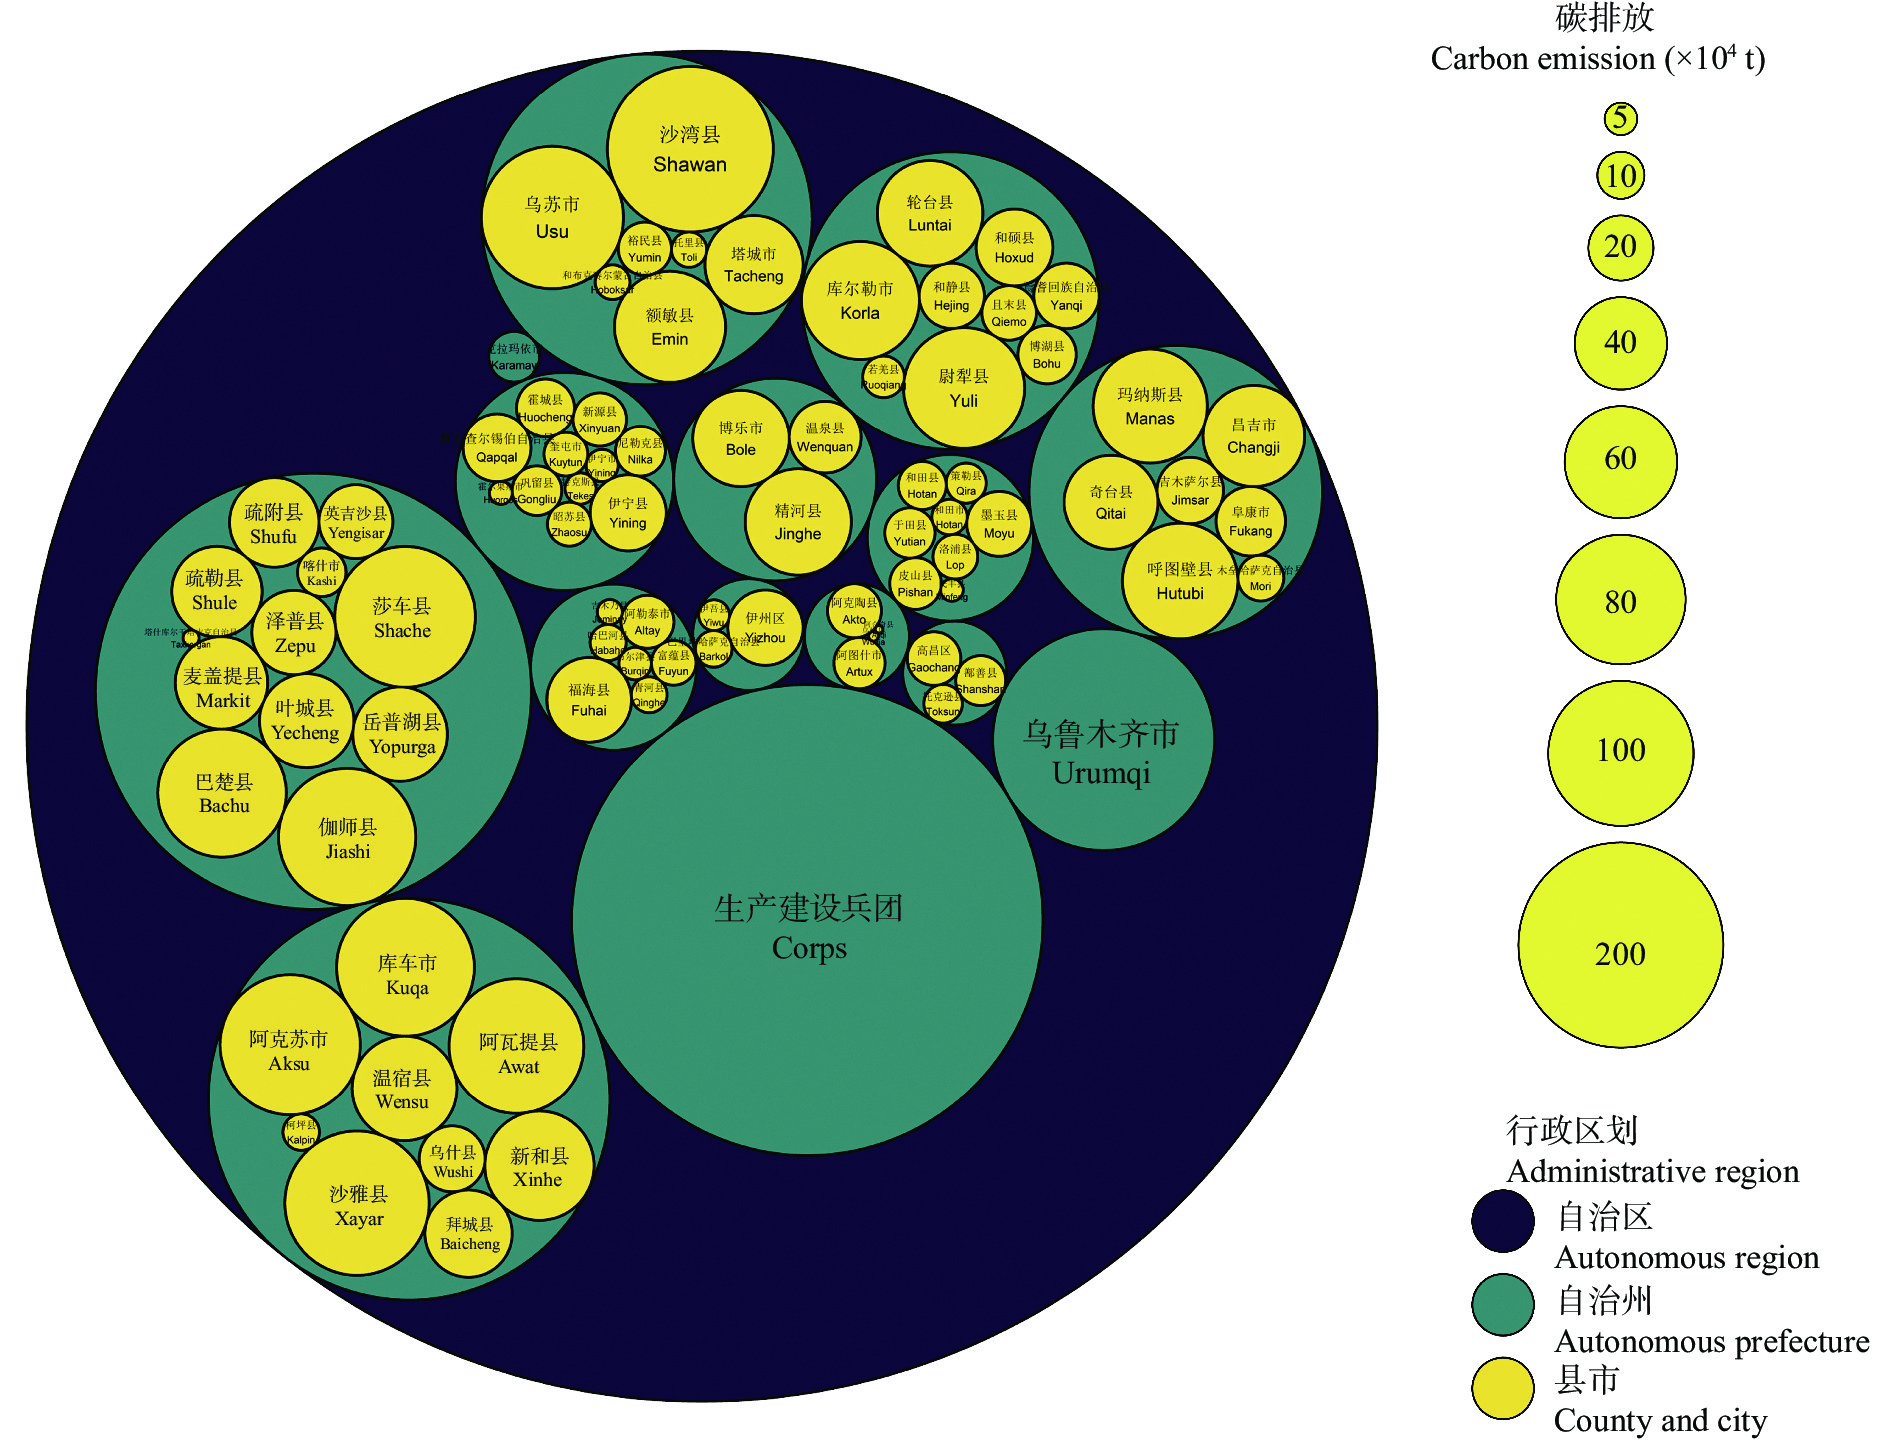
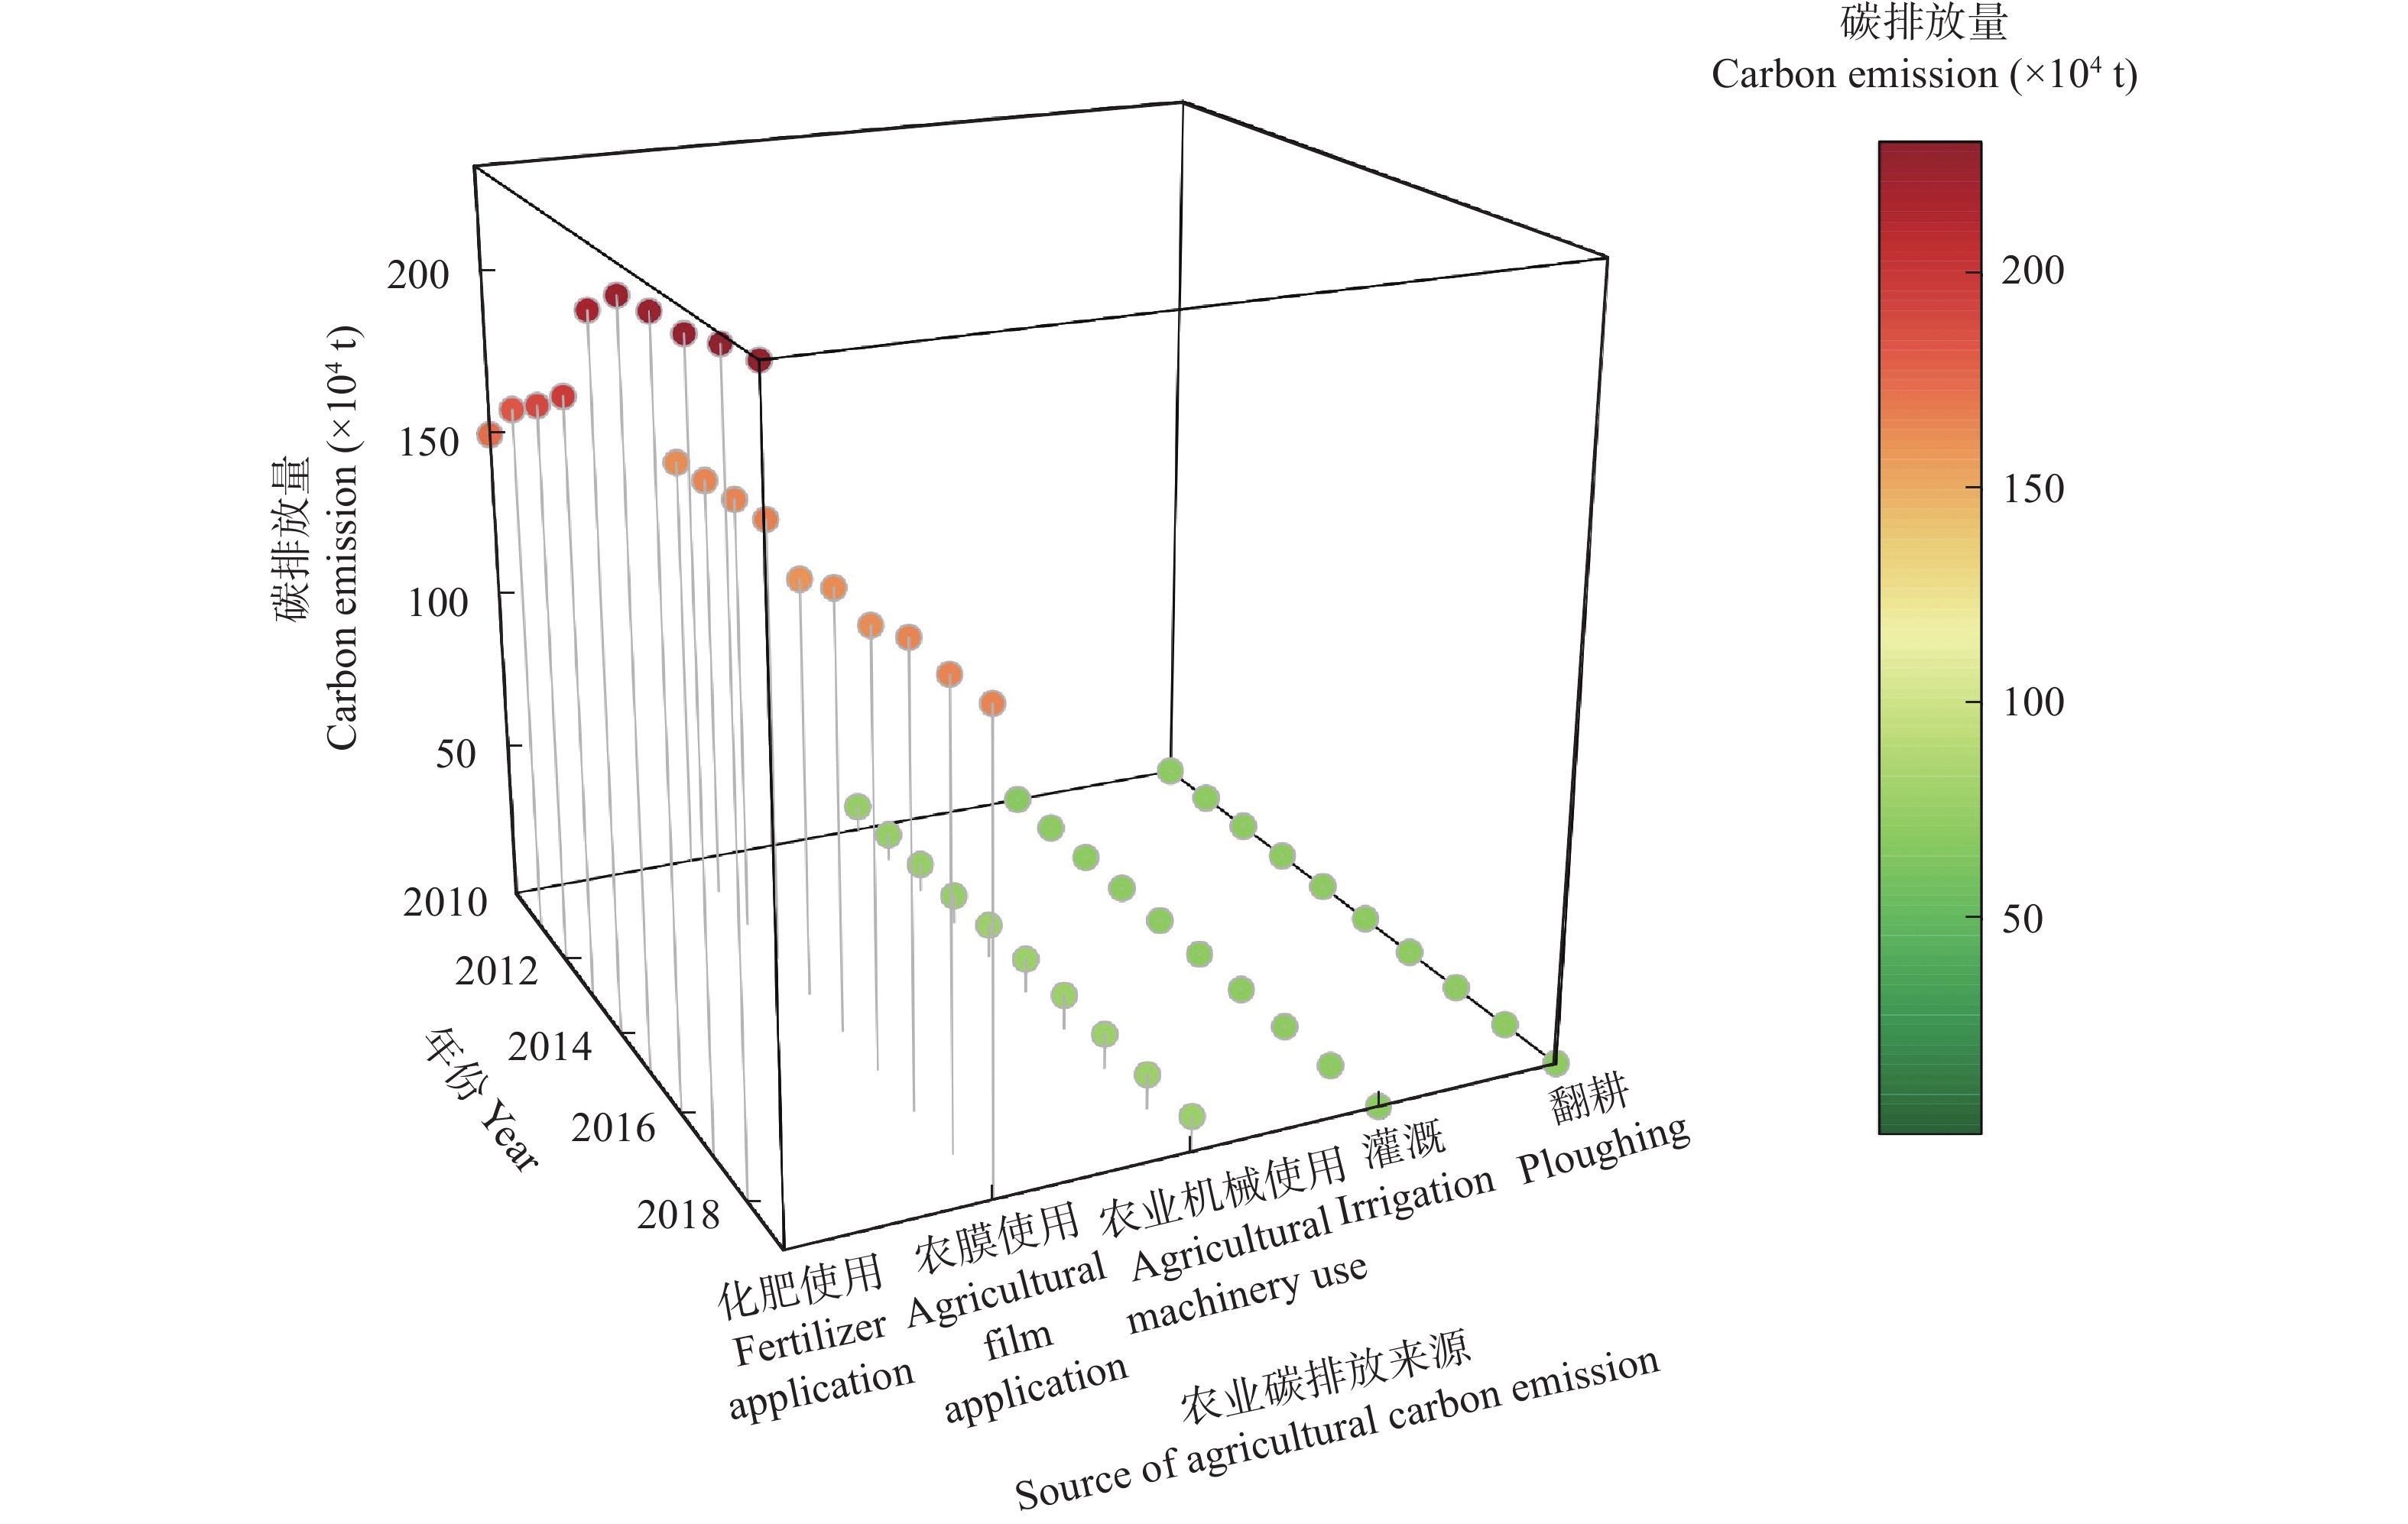
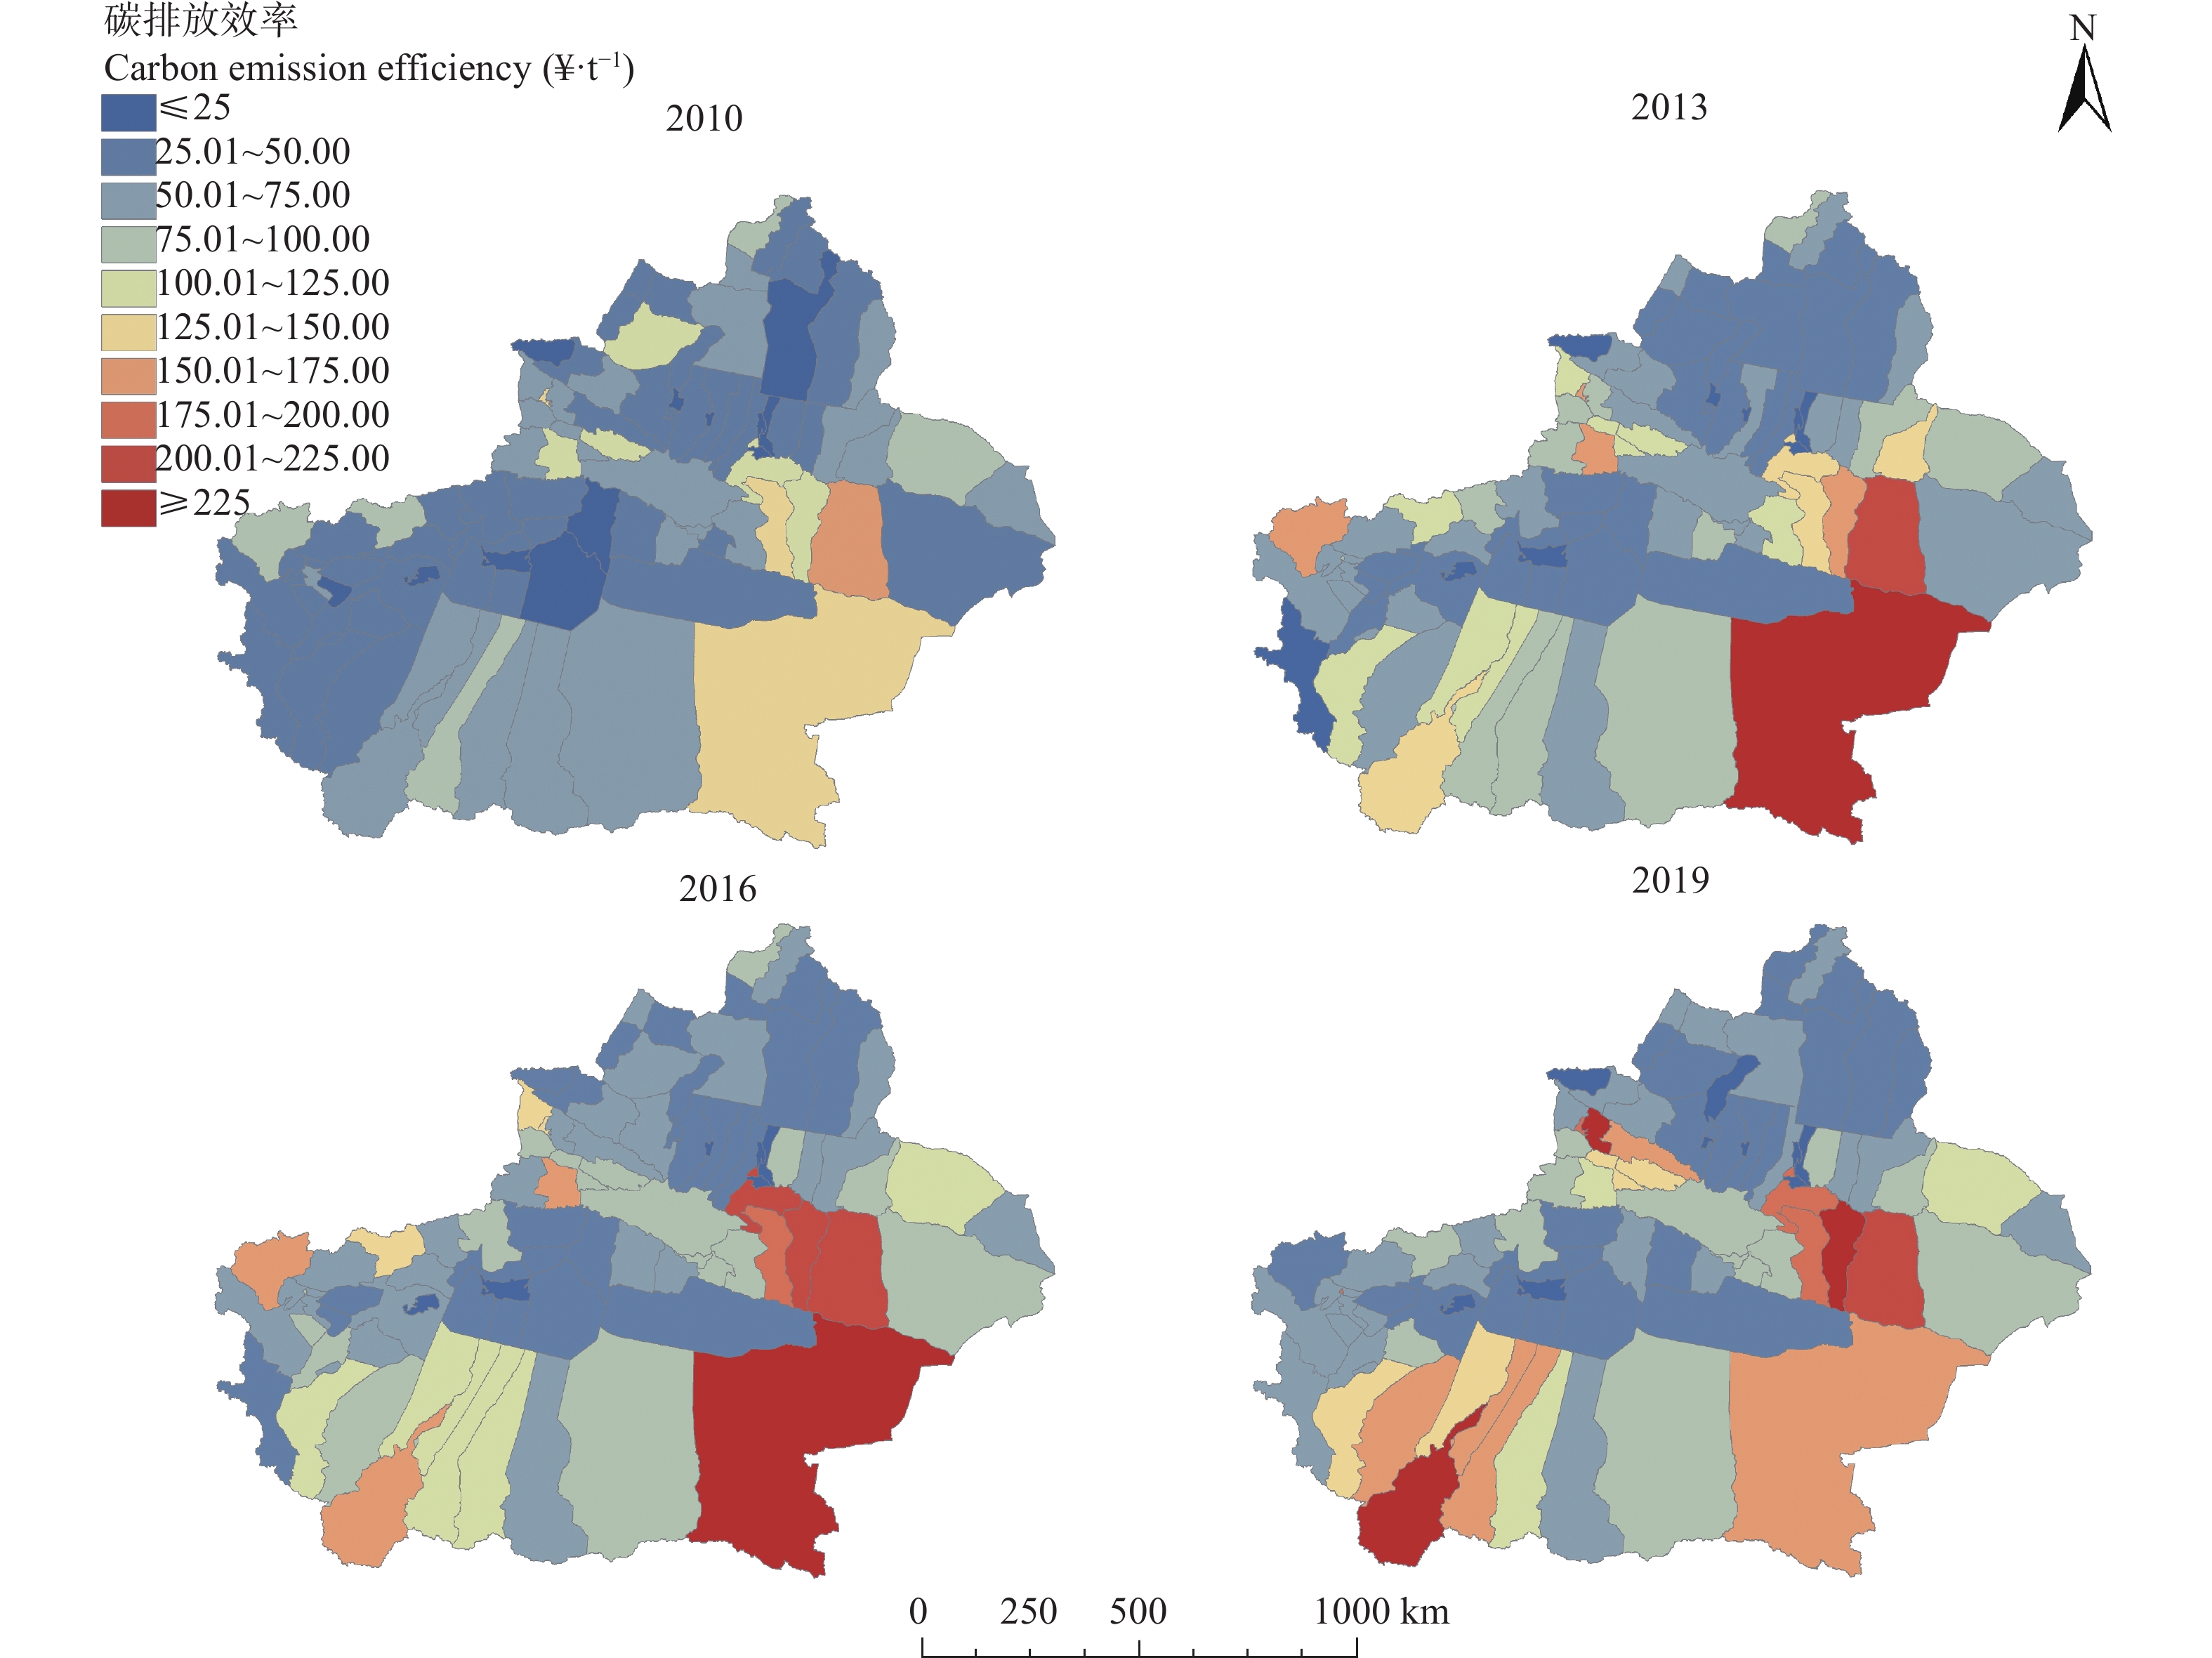
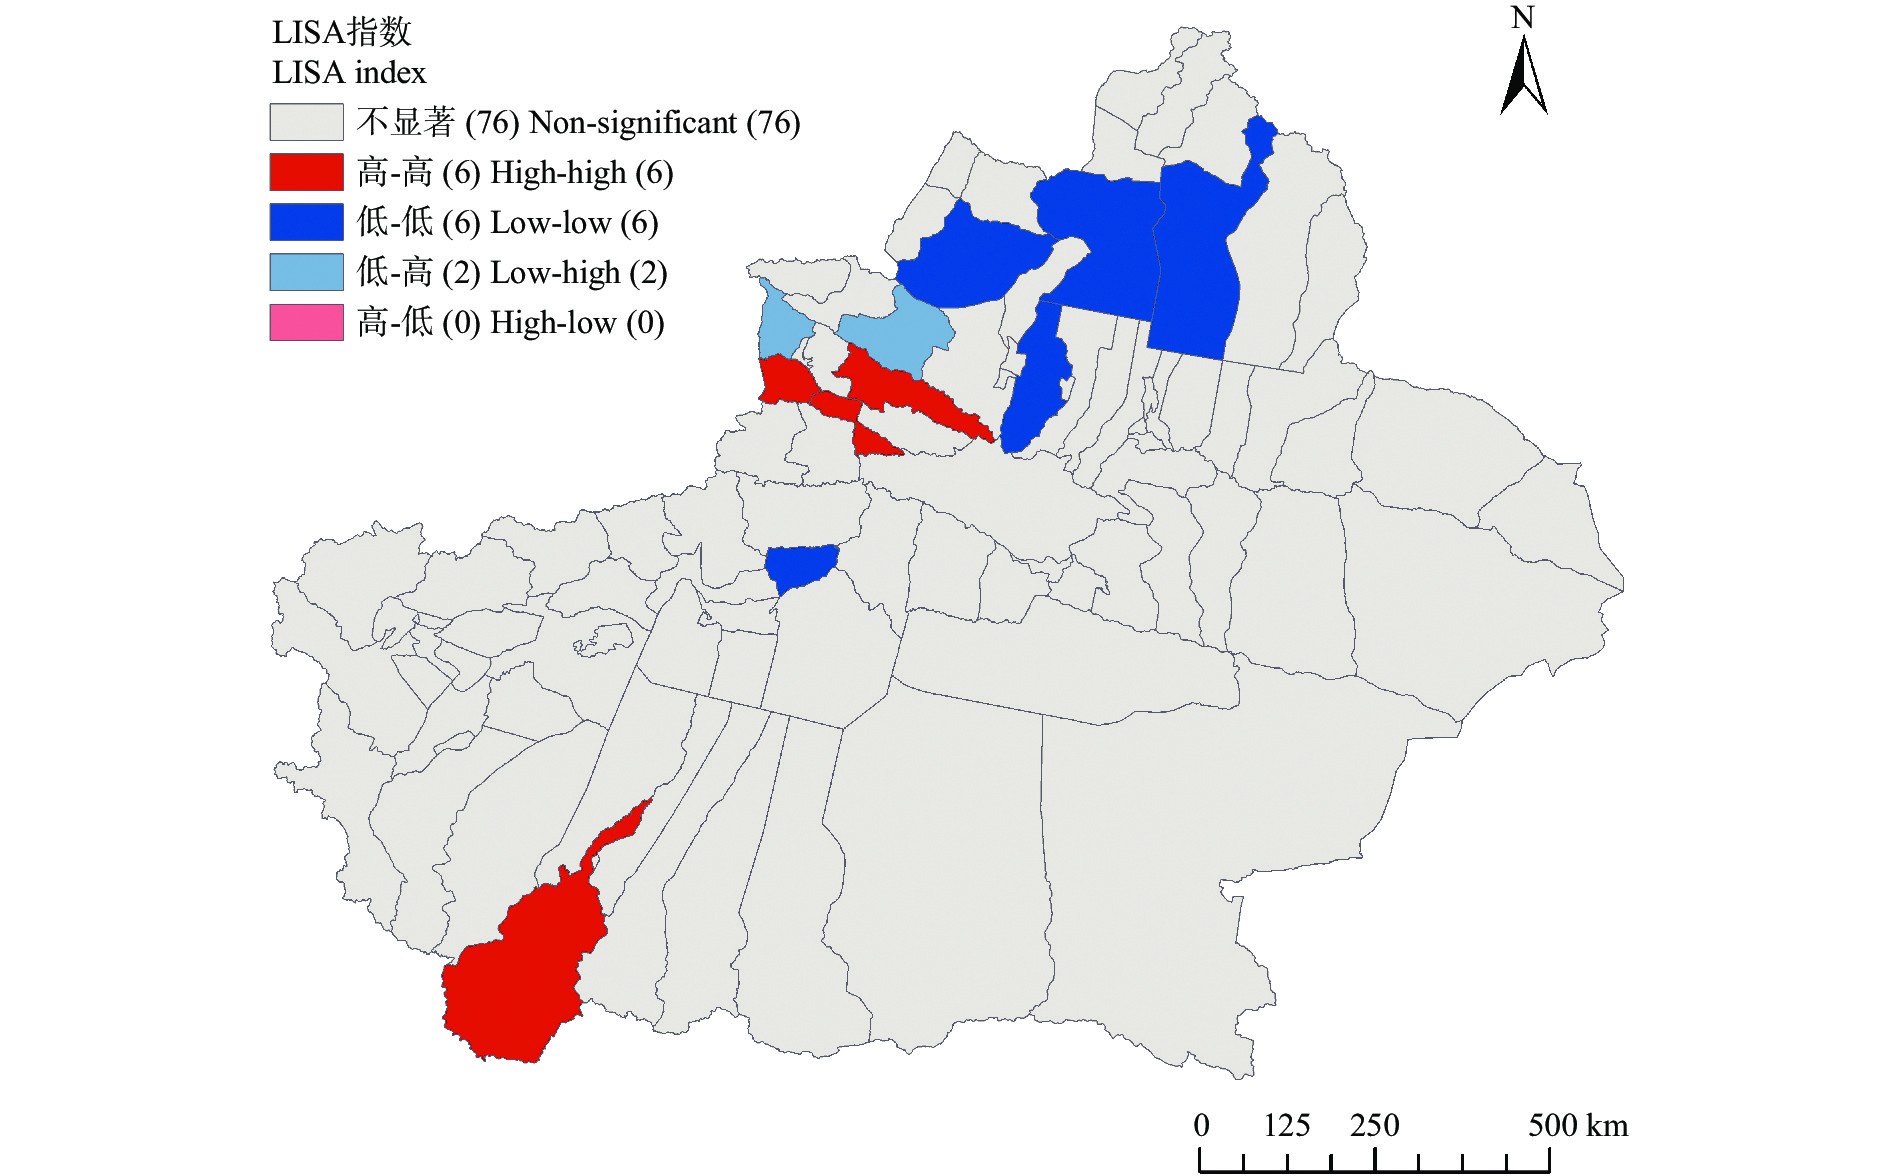
摘要: 农业是全球第二大碳源, 明确农业碳排放规律对于碳达峰、碳中和具有重要意义。为探究新疆农业碳排放规律, 促进农业碳减排, 本研究根据农业生产过程中的碳排放环节, 结合国内外发布的碳排放系数, 测算了新疆的农业碳排放量; 利用莫兰指数、LISA指数等空间相关性模型测算了新疆农业碳排放的空间集聚规律; 利用机器学习中的随机森林模型对农业碳排效率影响因素进行了动态量化分析。结果显示: 1) 2010—2019年新疆农业碳排放量缓慢增长, 从292.24万t增长到379.69万t, 年均增速3.33%。2)化肥和农膜的使用是新疆农业碳排放的主要来源, 占比分别为58.06%和39.03%。3)新疆农业碳排放效率在不断提升, 2010—2013年增速较快, 2014—2019年增速较慢, 碳排放效率的主要分布区间从小于50元∙t−1变为50~100元∙t−1。4)新疆农业碳排放效率高高聚集区域农业产值不高, 主要是由于物质投入低; 低低聚集区域农业产值相对较高, 但科技、管理水平低, 物质投入过多。5)降水量较低的南疆区域, 农业碳排放效率整体较高, 降水量较高的北疆区域, 农业碳排放效率处于中等水平。6)农业规模化程度在0.12~2.02 hm2∙人−1时, 碳排放效率随着农业规模化程度提高急剧降低, 当农业规模化程度高于2.02 hm2∙人−1时, 对农业碳排放效率的影响力降低; 耕地规模在120~17 220 hm2时, 对农业碳排放效率有一个显著的负向影响, 当耕地规模大于17 220 hm2时, 对农业碳排放效率的影响较为平缓。农村经济发展水平对碳排放效率具有正向影响, 农业电器化程度对碳排放效率呈现出正“U”型影响。Abstract: Agriculturl carbon emissions are the second-largest source of carbon in the world. Therefore, clarifying the patterns of agricultural carbon emissions is crucial for achieving carbon peaks and neutrality. To explore the law of agricultural carbon emissions in Xinjiang and promote agricultural carbon emission reduction, agricultural carbon emissions in Xinjiang were measured based on carbon emission coefficients published according to the carbon emission links generated in the process of agricultural production. Furthermore, spatial correlation models, such as the Moran and learned index structure for spatial data (LISA) indices, were used to measure the spatial clustering patterns of agricultural carbon emissions in Xinjiang. A random forest machine learning model was then used to quantitatively analyze the factors influencing the efficiency of agricultural carbon emissions. The results indicated that: 1) agricultural carbon emissions grew slowly from 2010 to 2019, from 292.24×04 t to 379.69×10⁴ t, with an average annual growth rate of 3.33%. 2) Applications of chemical fertilizers and agricultural films were the main sources of agricultural carbon emissions in Xinjiang, accounting for 58.06% and 39.03%, respectively. 3) Xinjiang’s agricultural carbon emission efficiency increased steadily, with a faster growth from 2010 to 2013 and a slower growth from 2014 to 2019. The main distribution range of carbon emissions efficiency increased from less than 50 ¥∙t−1 to 50–100 ¥∙t−1. 4) The agricultural output values in the high-high agglomeration areas of Xinjiang with high agricultural carbon emission efficiency were relatively low because of the low material input. In contrast, the agricultural output values in the low-low agglomeration areas were relatively high, however, where the level of technology and management was low, and the material input was extremely high. The efficiency of agricultural carbon emissions in Xinjiang has room for improvement. 5) Overall agricultural carbon emission efficiency was higher in the southern region with lower precipitation, whereas the northern region with higher precipitation exhibited moderate emissions. Precipitation may indirectly affect agricultural carbon emission efficiency by affecting the level of agricultural development and production technology. 6) Carbon emission efficiency decreased sharply with increased agricultural scale when the agricultural scale was between 0.12 and 2.02 hm2 per person. Moreover, the influence on agricultural carbon emissions efficiency decreased when the agricultural scale exceeded 2.02 hm2 per person. There was a significant negative effect on agricultural carbon emission efficiency when cultivated land was between 120 and 17 220 hm2. In contrast, its’ effect on agricultural carbon emission efficiency was more moderate when cultivated land was larger than 17 220 hm2. Rural economic development level had a positive effect on carbon emission efficiency. Furthermore, carbon emission efficiency exhibited a “U” shaped pattern as a function of agricultural electrification degree. Comprehensively considering the two aspects of improving agricultural output value and agricultural carbon emission efficiency, the degree of agricultural scale and the scale of arable land should be further improved to increase agricultural output value, and the level of rural economic development and the degree of agricultural electrification should be further improved to increase the efficiency of agricultural carbon emissions.
-
良好的土壤结构和肥力状况是实现农作物稳产、高产的重要前提, 保持并提高土壤肥力, 实现“藏粮于田、藏粮于技”是确保我国粮食安全和农业可持续发展的重要策略[1-2]。土壤团聚体和有机碳是影响土壤肥力水平的重要因素。土壤团聚体数量分布反映土壤持水性、养分供储、通透性等能力高低[3]。土壤有机碳活性组分(易氧化有机碳、水溶性有机碳、酸水解有机碳等)与土壤有效养分密切相关[4-5], 而有机碳稳定性组分(矿物有机碳、黑碳等)与土壤抗干扰和固碳能力相关[6]。
目前, 有机培肥(秸秆还田和增施有机肥)是提高土壤肥力的重要措施。秸秆还田能够显著提升土壤大团聚体数量(> 0.25 mm)、平均重量直径和几何平均直径[7]。秸秆覆盖还田配合免耕显著降低旱作农田0~5 cm、5~10 cm、10~30 cm土层的团聚体崩解指数和机械破坏指数[8]。秸秆还田配合旋耕能够显著增加土壤总有机碳和活性有机碳含量[9]。增施有机肥同样具有增加土壤水稳性团聚体含量和有机碳活性的作用[10]。翻耕基础上增施有机肥较单施化肥土壤大团聚体比例提高2.8%~8.4%[11]。此外, 黄壤性水稻土长期施用有机肥能够在促进土壤有机碳积累的同时降低其累积矿化率, 增强土壤固碳能力[12]。深松和免耕配合施用牛粪显著增加土壤总有机碳含量, 并提高作物产量[13]。因此, 不同有机培肥措施需要合适的耕作措施与之匹配才能更好地发挥培肥效果。
秸秆还田或增施有机肥下, 不同耕作措施对农田土壤团聚体和有机碳影响的研究多集中于旱地土壤, 以水稻(Oryza sativa)、小麦(Triticum aestivum)轮作农田为对象的研究较少。虽然已有研究表明稻麦轮作下有机物(秸秆和有机肥)能够增加土壤肥力, 但不同有机物和耕作措施对土壤团聚体和有机碳组成的作用及其交互作用关系还不清楚。本文通过两年大田定位试验, 研究稻麦轮作下不同有机物和耕作措施及其交互作用对土壤水稳性团聚体、有机碳活性组分和有机碳稳定性组分的影响, 为构建稻麦轮作土壤有机培肥相匹配的耕作制度提供理论依据和实践指导。
1. 材料与方法
1.1 试验地概况
试验于江汉平原腹地的农业农村部潜江农业环境与耕地保育科学观测实验站内(湖北省潜江市浩口镇柳洲村, 112°37′E, 30°22′N)进行。试验点所在区域属亚热带季风气候区, 年平均气温16.1 ℃, 年均降水量1 100~1 300 mm。土壤为潴育型水稻土, 质地是砂质黏壤土。土壤耕层基本理化性质:容重1.20 g·cm−3, 有机质20.32 g·kg−1, 全氮1.5 g·kg−1, 有效磷12.18 mg·kg−1, 速效钾84.77 mg·kg−1, pH 6.70。
1.2 试验设计
试验采用随机区组设计, 共5个处理, 每个处理3次重复, 共15个小区, 小区面积为50 m2, 试验地种植制度为水稻、小麦两熟制, 大田试验始于2016年, 开始前茬作物为水稻。试验设置: 1)稻麦秸秆还田配合旋耕(SR), 每季作物成熟后, 采用半喂入联合收割机进行作物收获及秸秆粉碎, 留茬约20 cm, 秸秆粉碎长度约10 cm, 粉碎后的秸秆旋耕还田, 旋耕深度15 cm; 周年秸秆还田总量约为11 000 kg·hm−2, 水稻和小麦秸秆有机碳含量按46%计算, 秸秆还田带入土壤的有机碳约5 060 kg·hm−2。2)稻麦秸秆还田配合翻耕(SP), 粉碎后的秸秆翻耕还田, 翻耕深度30 cm, 其余同SR。3)秸秆不还田, 增施有机肥配合旋耕(MR), 采用半喂入联合收割机进行作物收获后, 人工齐地割除根茬, 秸秆和根茬全部移出田面, 有机肥替代50%化学氮肥, 旋耕深度15 cm; 周年有机肥施用量为5 289 kg·hm−2, 其有机碳含量17.2%, 有机肥带入的有机碳含量约为910 kg·hm−2。4)秸秆不还田, 增施有机肥配合翻耕(MP), 翻耕深度30 cm, 其他同MR。5)秸秆不还田, 不施用有机肥, 旋耕深度15 cm(CKR)。供试水稻品种为‘广两优香5’, 按16.7 cm×26.4 cm人工栽秧, 每兜2株。小麦供试品种为‘郑麦9023’, 人工条播, 播种量为112.5 kg·hm−2。
有机肥、氮肥、磷肥、钾肥分别为腐熟猪粪(含有机质29.72%、N 3.1%、P2O5 4.1%、K2O 1.9%)、尿素(含N 46%)、过磷酸钙(含P2O5 12%)和氯化钾(含K2O 60%)。各处理施用肥料的总养分保持一致, 水稻和小麦施肥量分别为N 180 kg·hm−2、P2O5 75 kg·hm−2、K2O 120 kg·hm−2和N 150 kg·hm−2、P2O5 90 kg·hm−2、K2O 75 kg·hm−2。有机肥、磷肥和钾肥全部做基肥一次施入, 秸秆还田处理的尿素分基肥(70%)和追肥(30%)施用, 增施有机肥处理的尿素分基肥(50%)和追肥(50%)施用。水稻季追肥于水稻移栽后7 d撒施, 小麦季追肥于拔节期撒施。
1.3 样品采集和测定
2018年5月21日和10月9日分别在小麦和水稻收获后选择各小区收割机未走过的区域, 按“S”采样法采集0~20 cm土层供试土样500 g左右, 装于硬质塑料盒带回实验室风干。
土壤有机碳采用重铬酸钾外加热法测定; 土壤容重、总孔隙度和毛管孔隙度采用环刀法测定[14]; 水稳性团聚体采用干筛法和湿筛法进行测定, 所用仪器为土壤团粒分析仪(日本, Daiki, DIK-2012), 套筛孔径分别为2 mm、0.25 mm和0.053 mm[3]。
有机碳活性组分的测定:水溶性有机碳(DOC)采用超纯水提取[15], 易氧化有机碳(EOC)采用333 mmol·L−1 KMnO4氧化法测定[16], 酸水解有机碳采用H2SO4水解法[包括活性组分Ⅰ(LPⅠc)和活性组分Ⅱ(LPⅡc)]和HCl水解法(HClc)测定[4, 17], 颗粒有机碳(POC)采用5 g·L−1六偏磷酸钠分散法进行提取[18]。
有机碳稳定性组分的测定:矿物结合态有机碳(MOC)的化学分离基于Eusterhues等[19]的方法, 黑碳(BC)的分离基于尹云峰等[20]的方法。
1.4 数据处理
采用DPS7.5软件进行数据统计分析, 将试验总变异分为区组间、耕作因素、有机物因素、两因素交互效应、误差5部分, 各部分所引起的变异大小由其所产生的平方和表示, 因此耕作因素、有机物因素及其交互效应作用力用下式计算[21]:
$$ 耕作作用力=耕作变量(平方和)/总变量(总平方和)×100\% $$ (1) $$ 有机物作用力=有机物变量(平方和)/总变量(总平方和)×100\% $$ (2) $$ 交互作用力=交互变量(平方和)/总变量(总平方和)×100\% $$ (3) 2. 结果与分析
2.1 有机物和耕作措施对土壤结构的影响
短期内(2年), 小麦季添加外源有机物后土壤容重均略低于对照(CKR), 各处理土壤容重降低量介于0.04~0.08 g·cm−3, 但变化不显著(P > 0.05);总孔隙度均略高于对照, 各处理总孔隙度增加量介于1.2%~2.8%, 变化不显著(P > 0.05)。水稻季, 不同耕作措施下土壤容重和总孔隙度的变化较大, 容重介于1.14~1.30 g·cm−3, 总孔隙度介于50.95%~57.13%。其中, 秸秆还田配合旋耕(SR)土壤容重显著低于CKR(P < 0.05), 总孔隙度显著高于CKR(P < 0.05)。可见, 外源有机物有助于降低土壤容重并提高总孔隙度, 改善土壤物理结构(表 1)。
表 1 外源有机物和耕作方式对稻麦轮作系统作物收获后土壤容重和孔隙度的影响Table 1. Effects of exogenous organic materials and tillage methods on soil bulk density and porosity after crop harvest of rice-wheat rotation system作物季
Corp season处理
Treatment容重
Bulk density (g·cm−3)总孔隙度
Total porosity (%)毛管孔隙度
Capillary porosity (%)小麦季
Wheat seasonCKR 1.15±0.02a 56.73±0.91a 53.77±1.08ab SR 1.11±0.02a 57.93±0.68a 59.50±2.48a SP 1.07±0.04a 59.53±1.50a 54.85±0.07ab MR 1.10±0.10a 58.40±3.63a 54.46±2.42ab MP 1.10±0.10a 58.56±3.81a 51.98±0.46b 水稻季
Rice seasonCKR 1.23±0.01a 53.67±0.39b 46.66±1.18a SR 1.14±0.03b 57.13±1.24a 49.31±0.06a SP 1.24±0.01a 53.04±0.34b 46.84±2.35a MR 1.23±0.01a 53.48±0.54b 47.74±0.51a MP 1.30±0.02a 50.95±0.70b 45.79±0.91a CKR:秸秆不还田、不施有机肥, 旋耕; SR:秸秆旋耕还田; SP:秸秆翻耕还田; MR:增施有机肥, 旋耕; MP:增施有机肥, 翻耕。同列同作物季不同小写字母表示各处理间差异显著(P < 0.05)。CKR: rotary tillage without straw returning and organic fertilizer application; SR: rotary tillage with straw returning; SP: ploughing with straw returning; MR: rotary tillage with organic fertilizer application; MP: ploughing with organic fertilizer application. Different lowercase letters in the same column for the same crop season mean significant differences among treatments at 0.05 level. 除秸秆还田配合翻耕(SP)处理外, 添加外源有机物后土壤大团聚体(0.25~2 mm和 > 2 mm)含量略高于CKR处理(图 1)。小麦季和水稻季土壤大团聚体含量最高的处理分别为SR和MR, 分别比CKR处理提高2.6%和4.0%, 但差异不显著(P > 0.05)。0.05~ 0.25 mm团聚体, 小麦季SR处理 > 0.05 mm团聚体显著高于CKR处理, 比CKR增加7.2%。不同耕作措施对土壤大团聚体含量无明显促进作用, 翻耕措施大团聚体含量略低于旋耕措施, 其中SP处理土壤大团聚体含量最低。可见, 外源有机物有助于促进表层土壤水稳性团聚体形成, 并且有机物配合旋耕对水稳性团聚体提升效果优于配合翻耕。
![]() 图 1 外源有机物和耕作方式对稻麦轮作系统作物收获后土壤团聚体分布特征的影响CKR:秸秆不还田、不施有机肥, 旋耕; SR:秸秆旋耕还田; SP:秸秆翻耕还田; MR:增施有机肥, 旋耕; MP:增施有机肥, 翻耕。不同小写字母表示各处理间差异显著(P < 0.05)。Figure 1. Effects of exogenous organic materials and tillage methods on distribution characteristic of soil aggregates after crop harvest of rice-wheat rotation systemCKR: rotary tillage without straw returning and organic fertilizer application; SR: rotary tillage with straw returning; SP: ploughing with straw returning; MR: rotary tillage with organic fertilizer application; MP: ploughing with organic fertilizer application. Different lowercase letters mean significant differences among different treatments at 0.05 level.
图 1 外源有机物和耕作方式对稻麦轮作系统作物收获后土壤团聚体分布特征的影响CKR:秸秆不还田、不施有机肥, 旋耕; SR:秸秆旋耕还田; SP:秸秆翻耕还田; MR:增施有机肥, 旋耕; MP:增施有机肥, 翻耕。不同小写字母表示各处理间差异显著(P < 0.05)。Figure 1. Effects of exogenous organic materials and tillage methods on distribution characteristic of soil aggregates after crop harvest of rice-wheat rotation systemCKR: rotary tillage without straw returning and organic fertilizer application; SR: rotary tillage with straw returning; SP: ploughing with straw returning; MR: rotary tillage with organic fertilizer application; MP: ploughing with organic fertilizer application. Different lowercase letters mean significant differences among different treatments at 0.05 level.2.2 有机物和耕作措施对土壤有机碳组分的影响
增加外源有机物后土壤有机碳活性组分整体上高于CKR处理(表 2)。相比CKR, 供试土壤DOC增加量依次为MP处理(23.0 mg·kg−1) > SR处理(18.6 mg·kg−1) > MR处理(8.3 mg·kg−1) > SP处理(4.8 mg·kg−1)(表 2)。供试土壤EOC和LPⅠc含量均为SR处理最高, 显著高于CKR处理(P < 0.05), 分别提高0.3 g·kg−1和2.6 g·kg−1。不同外源有机物处理的LPⅡc含量为2.9~3.4 g·kg−1, 显著高于CKR处理(SP处理增加量为1.7 g·kg−1)(P < 0.05)。此外, 不同外源有机物对土壤HClc和POC无显著影响, 但相同耕作措施下, 秸秆还田处理POC平均含量高于增施有机肥处理和CKR, 以秸秆还田配合旋耕措施土壤POC含量最高(达5.4 g·kg−1); HClc的变化趋势与POC相反, 以增施有机肥配合翻耕措施最高(达6.2 g·kg−1)。可以看出, 增加外源有机物能够提高土壤水溶性有机碳、易氧化有机碳、酸水解有机碳和颗粒有机碳的含量, 秸秆还田配合旋耕显著提升土壤EOC、LPⅠc和LPⅡc含量。
表 2 外源有机物和耕作方式对稻麦轮作系统土壤有机碳活性组分的影响Table 2. Effects of exogenous organic materials and tillage methods on active components of soil organic carbon of rice-wheat rotation system处理
TreatmentDOC (mg·kg−1) EOC (g·kg−1) LPⅠc (g·kg−1) LPⅡc (g·kg−1) HClc (g·kg−1) POC (g·kg−1) CKR 89.1±4.3b 1.4±0.1b 7.9±0.4b 1.7±0.0b 5.1±0.9a 4.4±0.4b SR 107.7±7.3ab 1.7±0.1a 10.5±1.8a 2.9±0.0a 5.6±0.0a 5.4±0.5a SP 93.9±8.8ab 1.5±0.1a 8.0±0.2b 3.4±0.2a 5.5±0.3a 4.9±0.1ab MR 97.4±1.6ab 1.3±0.0b 8.7±0.6ab 3.0±0.1a 5.5±0.5a 4.3±0.2b MP 112.1±8.6a 1.6±0.0a 8.5±0.3b 3.1±0.0a 6.2±0.4a 4.5±1.7b CKR:秸秆不还田、不施有机肥, 旋耕; SR:秸秆旋耕还田; SP:秸秆翻耕还田; MR:增施有机肥, 旋耕; MP:增施有机肥, 翻耕。DOC:水溶性有机碳; EOC: 333 mmol·L-1 KMnO4提取的有机碳; LPⅠc: 2.5 mol·L-1 H2SO4提取的有机碳; LPⅡc: 1 mol·L-1 H2SO4提取的有机碳; HClc: 6 mol·L-1 HCl提取的有机碳; POC:颗粒有机碳。同列不同小写字母表示各处理间差异显著(P < 0.05)。CKR: rotary tillage without straw returning and organic fertilizer application; SR: rotary tillage with straw returning; SP: ploughing with straw returning; MR: rotary tillage with organic fertilizer application; MP: ploughing with organic fertilizer application. DOC: dissolve organic carbon; EOC: organic carbon extracted by 333 mmol·L-1 KMnO4; LPⅠc: organic carbon extracted by 2.5 mol·L-1 H2SO4; LPⅡc: organic carbon extracted by 1 mol·L-1 H2SO4; HClc: organic carbon extracted by 6 mol·L-1 HCl; POC: particulate organic carbon. Different lowercase letters in the same column mean significant differences among treatments at 0.05 level. 黑碳(BC)和矿物结合态有机碳(MOC)一定程度上能够反映土壤中有机碳稳定性组分[22]。不同外源有机物处理SOC、BC和MOC含量均高于CKR处理。秸秆还田处理土壤BC和MOC含量分别约为5.4 g·kg−1和4.7 g·kg−1, 增施有机肥处理BC和MOC含量约为5.5~5.8 g·kg−1和5.0 g·kg−1(表 3)。这说明秸秆还田处理稳定性有机碳含量略低于增施有机肥处理。除SR处理外, 各处理BC/SOC和MOC/SOC值分别为0.41和0.37左右, 相比CKR处理约分别增加0.03和0.06。可见, 外源有机物对土壤有机碳稳定性有一定促进作用, 但影响不显著。
表 3 外源有机物和耕作方式对稻麦轮作系统土壤有机碳组分及其稳定性的影响Table 3. Effects of exogenous organic materials and tillage methods on components and stability of soil organic carbon of rice-wheat rotation system处理Treatment SOC (g·kg−1) BC (g·kg−1) MOC (g·kg−1) BC/SOC MOC/SOC CKR 12.6±1.0b 5.0±0.0b 4.4±0.2b 0.38 0.31 SR 14.2±0.1ab 5.4±0.1ab 4.6±0.0ab 0.38 0.32 SP 13.4±1.5ab 5.4±0.1ab 4.8±0.1ab 0.40 0.36 MR 13.3±1.1ab 5.5±0.1ab 5.1±0.1a 0.41 0.38 MP 13.5±1.1ab 5.8±0.1a 5.0±0.1ab 0.43 0.37 CKR:秸秆不还田、不施有机肥, 旋耕; SR:秸秆旋耕还田; SP:秸秆翻耕还田; MR:增施有机肥, 旋耕; MP:增施有机肥, 翻耕。SOC:总有机碳; BC:黑碳; MOC:矿物结合态有机碳。同列不同小写字母表示各处理间差异显著(P < 0.05)。CKR: rotary tillage without straw returning and organic fertilizer application; SR: rotary tillage with straw returning; SP: ploughing with straw returning; MR: rotary tillage with organic fertilizer application; MP: ploughing with organic fertilizer application. SOC: total organic carbon; BC: black carbon; MOC: mineral-bonded organic carbon. Different lowercase letters in the same column mean significant differences among treatments at 0.05 level. 2.3 有机物、耕作及其交互效应对土壤团聚体和有机碳组分的影响
大于2 mm团聚体主要作用力为有机物, 其作用力大小为36.4%, 但是未达显著水平。0.25~2 mm和0.05~0.25 mm团聚体主要作用力来自耕作和有机物的交互作用, 其作用大小分别为33.1%和64.5%, 达显著水平(P < 0.05)(表 4)。这说明供试土壤团聚体组成主要受耕作和有机物的双因素的影响。
表 4 耕作因素、有机物及其交互效应对稻麦轮作系统土壤团聚体的作用力Table 4. Affecting forces of tillage methods, organic materials and their interaction on soil aggregates of rice-wheat rotation system% 差异来源
Difference source土壤团聚体粒径Soil aggregates size (mm) > 2 0.25~2 0.05~0.25 < 0.05 区组Block 6.3 19.8 8.0 7.4 耕作Tillage 0.2 9.3 2.1 16.3 有机物Organic materials 36.4 5.0 9.6 4.1 耕作×有机物Tillage × organic materials 1.4 33.1* 64.5* 0.2 误差Error 55.6 33.0 15.8 72.0 *表示影响显著(P < 0.05)。* means significant effect at P < 0.05 level. 整体上, 耕作措施对有机碳活性组分具有较强的作用力, 而各处理对稳定性有机碳作用效果不明显。其中, DOC和EOC主要作用力来自耕作和有机物的交互作用, 分别为36.4%和54.0%。LPⅡc主要作用力来自耕作, 作用力大小为26.6%, 达显著水平(P < 0.05)(表 5)。有机物对POC具有显著作用力, 作用力大小为40.5%。这说明酸水解有机碳更易受耕作过程中土壤扰动的影响, 而POC更易受秸秆、有机肥等外源有机物输入的影响。
表 5 耕作因素、有机物及其交互效应对稻麦轮作系统土壤有机碳组分的作用力Table 5. Affecting forces of tillage methods and organic materials and their interaction on soil organic carbon fractions of rice-wheat rotation system% 差异来源
Difference source有机碳组分Fraction of soil organic carbon DOC EOC LPⅠc LPⅡc HClc POC SOC BC MOC 区组Block 18.4 1.2 4.4 21.5 20.4 25.3 9.1 7.4 21.1 耕作Tillage 0.0 23.4 27.7 26.6* 6.5 1.8 6.1 5.5 3.5 有机物Organic materials 2.7 0.1 6.3 3.6 10.2 40.5* 14.5 15.0 32.1 耕作×有机物Tillage × organic materials 36.4 53.0 20.6 22.8* 12.6 9.6 25.0 4.5 6.4 误差Error 42.4 24.0 41.0 25.6 50.2 22.9 45.3 67.7 36.9 DOC:水溶性有机碳; EOC: 333 mmol·L-1 KMnO4提取的有机碳; LPⅠc: 2.5 mol·L-1 H2SO4提取的有机碳; LPⅡc: 1 mol·L-1 H2SO4提取的有机碳; HClc: 6 mol·L-1 HCl提取的有机碳; POC:颗粒有机碳; SOC:总有机碳; BC:黑碳; MOC:矿物结合态有机碳。*表示影响显著(P < 0.05)。DOC: dissolve organic carbon; EOC: organic carbon extracted by 333 mmol·L-1 KMnO4; LPⅠc: organic carbon extracted by 2.5 mol·L-1 H2SO4; LPⅡc: organic carbon extracted by 1 mol·L-1 H2SO4; HClc: organic carbon extracted by 6 mol·L-1 HCl; POC: particulate organic carbon; SOC: total organic carbon; BC: black carbon; MOC: mineral-bonded organic carbon. * means significant effect at P < 0.05 level. 2.4 有机物和耕作措施对作物产量的影响
短期内(两年)不同耕作与外源有机物对稻麦周年总产量的影响有限, 秸秆还田处理稻麦周年总产量仅比CKR处理提高(或减少)66.1~475.0 kg·hm-2, 增产(或减产)幅度介于0.5%~6.5%, 均未达显著水平(图 2)。其中, 秸秆还田配合旋耕措施周年总产量略高于秸秆还田配合翻耕措施和CKR。已有研究表明, 秸秆还田或耕作方式在短期内稻麦周年总产量存在减产现象, 减产幅度可达7.68%, 但不会产生显著影响[23-24]。除2018年MR处理外, 有机肥处理对稻麦周年总产量无显著降低影响。本文中, 有机肥为猪粪有机肥, 其施用量2 404 kg·hm-2和2 885 kg·hm-2。赵军等[25]研究发现, 短期内(两年)猪粪有机肥施用量在3 000 kg·hm-2和6 000 kg·hm-2时, 均会降低水稻和小麦产量构成因素和实际产量, 但未达显著水平, 这与本文研究结果一致。
![]() 图 2 2017年和2018年外源有机物和耕作方式对稻麦轮作系统作物产量的影响CKR:秸秆不还田、不施有机肥, 旋耕; SR:秸秆旋耕还田; SP:秸秆翻耕还田; MR:增施有机肥, 旋耕; MP:增施有机肥, 翻耕。不同小写字母表示各处理间差异显著(P < 0.05)。Figure 2. Effects of exogenous organic materials and tillage methods on grain yield of rice-wheat rotation system in 2017 and 2018CKR: rotary tillage without straw returning and organic fertilizer application; SR: rotary tillage with straw returning; SP: ploughing with straw returning; MR: rotary tillage with organic fertilizer application; MP: ploughing with organic fertilizer application. Different lowercase letters mean significant differences among treatments at 0.05 level.
图 2 2017年和2018年外源有机物和耕作方式对稻麦轮作系统作物产量的影响CKR:秸秆不还田、不施有机肥, 旋耕; SR:秸秆旋耕还田; SP:秸秆翻耕还田; MR:增施有机肥, 旋耕; MP:增施有机肥, 翻耕。不同小写字母表示各处理间差异显著(P < 0.05)。Figure 2. Effects of exogenous organic materials and tillage methods on grain yield of rice-wheat rotation system in 2017 and 2018CKR: rotary tillage without straw returning and organic fertilizer application; SR: rotary tillage with straw returning; SP: ploughing with straw returning; MR: rotary tillage with organic fertilizer application; MP: ploughing with organic fertilizer application. Different lowercase letters mean significant differences among treatments at 0.05 level.3. 讨论与结论
短期内, 耕作和有机物的交互作用能够显著影响0~20 cm土层的团聚体组成。土壤胶结物质是影响土壤团聚体含量和稳定性的内在因素, 而土壤团聚体的主要胶结剂包括有机质(含有机残体和菌丝等粗有机质)、黏粒和氧化物[26]。有机物的输入和耕作措施能够通过影响有机质组成影响团聚体的组成和稳定。本文中, 水稻季秸秆还田配合旋耕措施提高0~20 cm水稳性团聚体含量, 而秸秆还田配合翻耕措施降低土壤水稳性团聚体含量。研究表明, 秸秆还田增加土壤水稳性团聚体稳定性, 但是翻耕对土壤结构破坏程度大于旋耕, 降低表层土壤结构稳定性[27]。这主要是因为旋耕和翻耕措施对土壤的扰动深度有所差异, 导致秸秆还田深度有所不同。翻耕处理耕深至30 cm, 秸秆主要分布在表层和深层土壤, 而旋耕措施耕深约15 cm, 秸秆多分布于表层土壤。研究表明, 稻麦秸秆还田深度14 cm时腐解速率更快[28]。秸秆和有机肥分解过程为表层土壤提供更多胶结物质。田慎重等[21]研究表明, 秸秆还田配合旋耕表层土壤的有机碳含量高于秸秆还田配合翻耕措施。因此, 秸秆还田配合旋耕措施能在短期内提高或保持0~20 cm土层水稳性团聚体含量。
有机碳活性组分主要受耕作以及耕作与有机物交互作用的影响, 不同措施对有机碳稳定性组分的影响较小。Blair等[16]认为农业系统中, 人为管理措施主要影响土壤有机碳中活性有机碳部分。本研究中, 耕作对LPⅠc和LPⅡc具有较高的作用力, 其中对LPⅡc作用力显著, 达26.6%; EOC主要受耕作与有机物交互作用的影响。活性有机碳组分中EOC是植物养分的主要来源, LPⅠc主要包括淀粉、半纤维素、可溶性糖等碳水化合物, LPⅡc主要来自纤维素[29]。秸秆还田和增施有机肥均可提高土壤EOC、LPⅠc和LPⅡc含量, 并且有机物是土壤活性有机碳增加的主要贡献者[4]。秸秆和有机肥通过为微生物提供能源物质(碳源), 促进土壤微生物的生长、繁殖, 增加有机碳的活性组分含量[5]。而耕作措施会引起土壤扰动, 能够使土壤与有机物充分接触, 加速有机物分解[30]。对比两种耕作措施发现, 旋耕措施EOC和LPⅠc含量高于翻耕措施, 而LPⅡc含量趋势与之相反。旋耕和翻耕扰动下, 外源有机物能够与氧气充分接触, 刺激微生物分泌参与碳循环相关酶的活性, 提高活性有机碳组分。叶雪松[31]研究表明, 旋耕对土壤酶活性的影响高于翻耕措施。因此, 秸秆还田配合旋耕对土壤EOC和LPⅠc提升效果优于其他处理。
短期内, POC主要受外源有机物的作用, 有机物对POC作用力显著, 为40.5%。POC是介于半分解动植物体和通过腐殖化的有机质之间的过渡态有机碳库, 周转时间短。通常POC包括存在于团聚体与团聚体之间的孔隙和团聚体内的动植物残体[32]。农田土壤POC的含量与总有机碳含量和团聚体组成显著相关[33]。本研究中, 秸秆还田处理有机碳含量(13.4~14.2 g·kg-1)高于增施有机肥处理(13.3~13.5 g·kg-1)。研究表明, 外源有机物(秸秆和有机肥)能够增加土壤有机碳的直接输入量, 并且秸秆还田对有机碳的提升效果优于增施有机肥[13]。这主要是因为相比增施有机肥处理, 秸秆还田处理新鲜的有机物投入量大, 在逐渐分解过程中优先形成POC组分[34]。对于团聚体而言, 秸秆还田处理大团聚体含量却略低于或接近增施有机肥处理, 这与POC的变化趋势相反。说明供试土壤POC的主要形态可能为游离态, 位于团聚体与团聚体之间孔隙, 因此与团聚体组成表现出相反的趋势。综上所述, 土壤POC含量的增加主要归结于秸秆和有机肥等有机物的输入, 这与王朔林等[33]和武均等[35]的研究结果相吻合。
本研究采用大田试验, 研究了秸秆、有机肥、旋耕和翻耕措施对土壤团聚体组成、有机碳组分的影响。结果发现, 秸秆还田配合旋耕能够降低土壤容重并增加水稳性团聚体含量, 改善土壤物理结构。同时, 秸秆还田配合旋耕有助于提高土壤有机碳活性组分, 包括易氧化有机碳、酸水解有机碳和颗粒有机碳。大团聚体、易氧化有机碳主要作用力来自土壤耕作和有机物的交互作用; 而酸水解有机碳主要作用力来自耕作措施。
-
表 1 农业碳排放源及碳排放系数
Table 1 Agricultural carbon emission sources and carbon emission coefficients
碳源
Carbon source碳排放系数
Carbon emission coefficient参考来源
Reference source数据来源
Data source化肥
Fertilizer0.90 kg(C)·kg−1 美国橡树岭国家实验室
Oak Ridge National Laboratory, USA统计年鉴
Statistical Yearbook农膜
Agriculture film5.18 kg(C)·kg−1 南京农业大学农业资源与生态环境研究所
Institute of Agricultural Resources and Ecological Environment,
Nanjing Agricultural University由统计年鉴数据折算
Converted from Statistical Yearbook data农业机械
Agricultural machineryP×16.47 kg(C)·hm−2+
W×0.18 kg(C)·kW−1中国碳排放交易网
China Carbon Emission Trading Network统计年鉴
Statistical Yearbook农业灌溉
Agricultural irrigation2.6648 kg(C)·hm−2 West, et al.[31] 由统计年鉴数据折算
Converted from Statistical Yearbook data农业翻耕
Agricultural ploughing3.1260 kg(C)·hm−2 黄华等[32]
Huang, et al.[32]统计年鉴
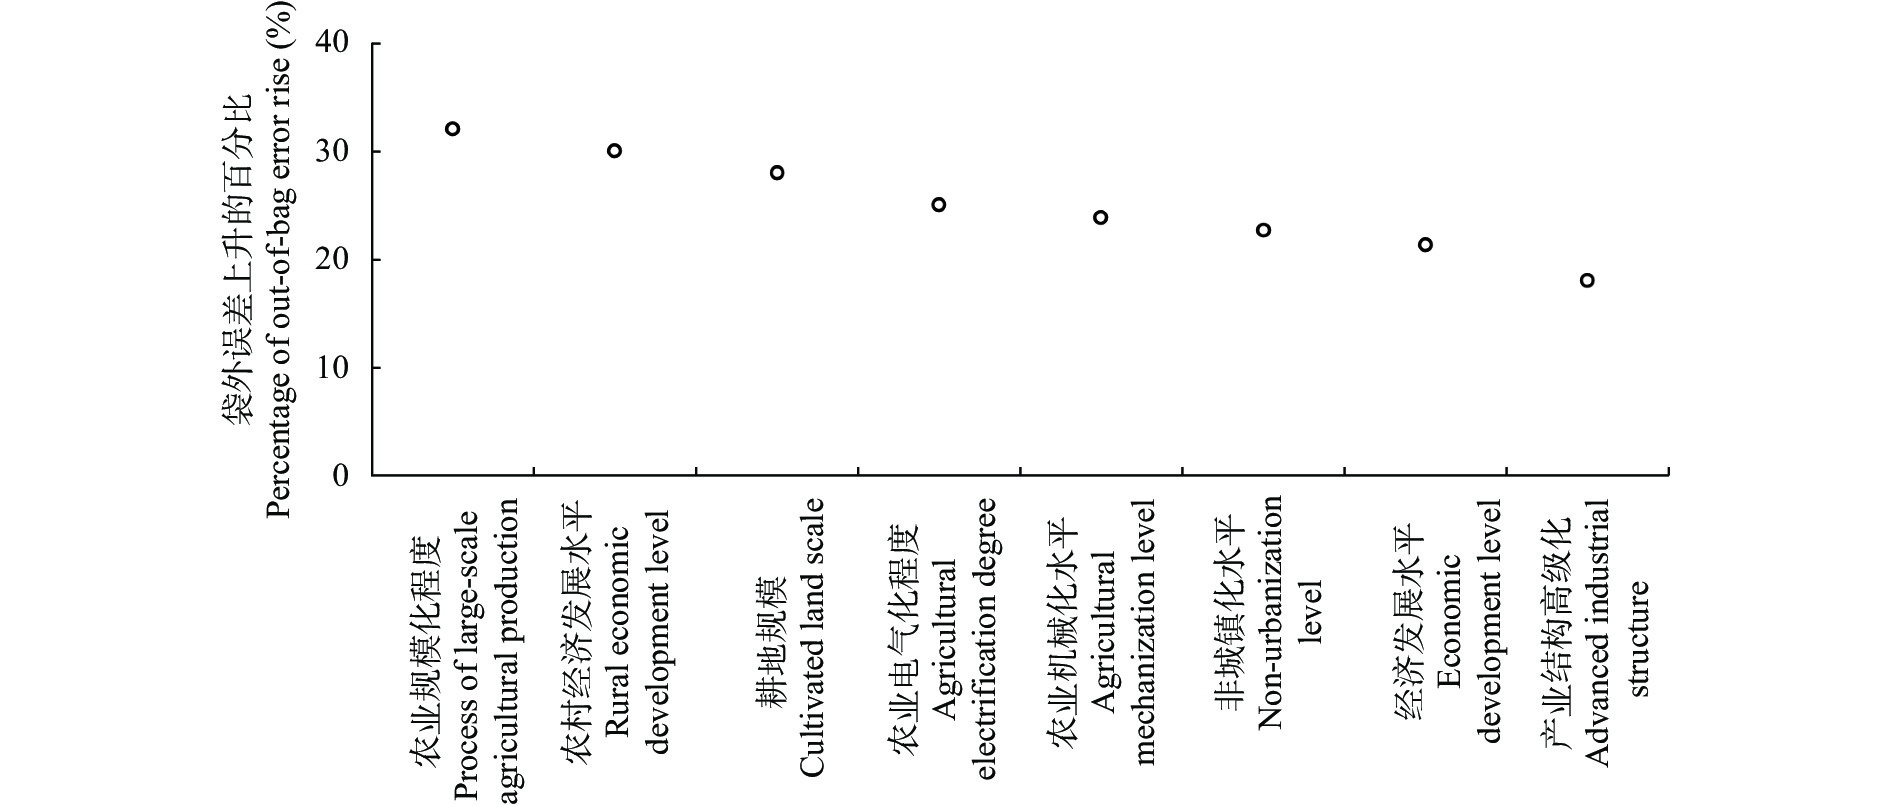
Statistical YearbookP为农业播种面积, W为农业机械总动力。P is the agricultural planting area, W is the total power of agricultural machinery. 表 2 农业碳排放影响因素指标体系
Table 2 Index system of influencing factors of agricultural carbon emission
指标 Index 度量方式 Measurement 单位 Unit 耕地规模
Cultivated land scale农作物播种面积
Crop planting area×103 hm2 非城镇化水平
Non-urbanization level乡村人口/总人口
Rural population/total population% 农村经济发展水平
Rural economic development level农业产值/从事农业人员
Agricultural output/persons engaged in agriculture×104·person−1 农业规模化程度
Process of large-scale argricultural production农作物播种面积/从事农业人员
Crop sown area/agricultural personnelhm2·person−1 农业电气化程度
Agricultural electrification degree农村用电量/乡村人口
Rural electricity consumption/rural population×104 kWh·person−1 经济发展水平
Economic development level地区生产总值
Regional GDP×104 ¥·person−1 农业机械化水平
Agricultural mechanization level机械总动力/农作物播种面积
Total mechanical power/crop planting areakW·hm−2
产业结构高级化
Advanced industrial structure第二、三产业/地区生产总值
Secondary and tertiary industries/regional GDP% -
[1] 政府间气候变化专门委员会(IPCC). 第四次报告[R]. https://www.ipcc.ch/. Intergovernmental Panel on Climate Change (IPCC). Fourth Report[R]. https://www.ipcc.ch/.
[2] JOHNSON J M F, FRANZLUEBBERS A J, WEYERS S L, et al. Agricultural opportunities to mitigate greenhouse gas emissions[J]. Environmental Pollution, 2007, 150(1): 107−124 doi: 10.1016/j.envpol.2007.06.030
[3] THAMO T, KINGWELL R S, PANNELL D J. Measurement of greenhouse gas emissions from agriculture: economic implications for policy and agricultural producers[J]. Australian Journal of Agricultural and Resource Economics, 2013, 57(2): 234−252 doi: 10.1111/j.1467-8489.2012.00613.x
[4] 李波, 张俊飚, 李海鹏. 中国农业碳排放时空特征及影响因素分解[J]. 中国人口·资源与环境, 2011, 21(8): 80−86 LI B, ZHANG J B, LI H P. Research on spatial-temporal characteristics and affecting factors decomposition of agricultural carbon emission in China[J]. China Population, Resources and Environment, 2011, 21(8): 80−86
[5] 闵继胜, 胡浩. 中国农业生产温室气体排放量的测算[J]. 中国人口·资源与环境, 2012, 22(7): 21−27 MIN J S, HU H. Calculation of greenhouse gases emission from agricultural production in China[J]. China Population, Resources and Environment, 2012, 22(7): 21−27
[6] 高鸣, 宋洪远. 中国农业碳排放绩效的空间收敛与分异−基于Malmquist-luenberger指数与空间计量的实证分析[J]. 经济地理, 2015, 35(4): 142−148, 185 GAO M, SONG H Y. Dynamic changes and spatial agglomeration analysis of the Chinese agricultural carbon emissions performance[J]. Economic Geography, 2015, 35(4): 142−148, 185
[7] 田云, 张俊飚, 李波. 中国农业碳排放研究: 测算、时空比较及脱钩效应[J]. 资源科学, 2012, 34(11): 2097−2105 TIAN Y, ZHANG J B, LI B. Agricultural carbon emissions in China: calculation, spatial-temporal comparison and decoupling effects[J]. Resources Science, 2012, 34(11): 2097−2105
[8] 田云, 张俊飚, 丰军辉, 等. 中国种植业碳排放与其产业发展关系的研究[J]. 长江流域资源与环境, 2014, 23(6): 781−791 doi: 10.11870/cjlyzyyhj201406006 TIAN Y, ZHANG J B, FENG J H, et al. Relationship between planting industry carbon emissions and its industry development in China[J]. Resources and Environment in the Yangtze Basin, 2014, 23(6): 781−791 doi: 10.11870/cjlyzyyhj201406006
[9] 张颂心. 中国农业碳排放量测算及影响因素分析−基于省级面板数据的研究[J]. 湖北农业科学, 2021, 60(1): 60−64, 95 ZHANG S X. Calculation of agricultural carbon emission and analysis of influencing factors in China: research based on the data of provincial panel[J]. Hubei Agricultural Sciences, 2021, 60(1): 60−64, 95
[10] 张丽琼, 何婷婷. 1997—2018年中国农业碳排放的时空演进与脱钩效应−基于空间和分布动态法的实证研究[J]. 云南农业大学学报(社会科学), 2022, 16(1): 78−90 doi: 10.12371/j.ynau(s).202103015 ZHANG L Q, HE T T. Spatio-temporal of agricultural carbon emission and decoupling in China during 1997−2018: an empirical research based on spatial and distribution dynamics method[J]. Journal of Yunnan Agricultural University (Social Science), 2022, 16(1): 78−90 doi: 10.12371/j.ynau(s).202103015
[11] 万运帆, 李玉娥, 林而达, 等. 静态箱法测定旱地农田温室气体时密闭时间的研究[J]. 中国农业气象, 2006, 27(2): 122−124 WAN Y F, LI Y E, LIN E D, et al. Studies on closing time in measuring greenhouse gas emission from dry cropland by static chamber method[J]. Chinese Journal of Agrometeorology, 2006, 27(2): 122−124
[12] LAL R. Carbon emission from farm operations[J]. Environment International, 2004, 30(7): 981−990 doi: 10.1016/j.envint.2004.03.005
[13] 李国志, 李宗植, 周明. 碳排放与农业经济增长关系实证分析[J]. 农业经济与管理, 2011(4): 32−39 doi: 10.3969/j.issn.1674-9189.2011.04.005 LI G Z, LI Z Z, ZHOU M. Empirical analysis on relationship between carbon emissions and agricultural economic growth[J]. Agricultural Economics and Management, 2011(4): 32−39 doi: 10.3969/j.issn.1674-9189.2011.04.005
[14] 程琳琳, 张俊飚, 何可. 农业产业集聚对碳效率的影响研究: 机理、空间效应与分群差异[J]. 中国农业大学学报, 2018, 23(9): 218−230 CHENG L L, ZHANG J B, HE K. Different spatial impacts of agricultural industrial agglomerations on carbon efficiency: Mechanism, spatial effects and groups differences[J]. Journal of China Agricultural University, 2018, 23(9): 218−230
[15] 程琳琳, 张俊飚, 何可. 空间视角下城镇化对农业碳生产率的直接作用与间接溢出效应研究[J]. 中国农业资源与区划, 2019, 40(11): 48−56 CHENG L L, ZHANG J B, HE K. The direct influence and indirect spillover effect of urbanization on agricultural carbon productivity base on the spatial durbin model[J]. Chinese Journal of Agricultural Resources and Regional Planning, 2019, 40(11): 48−56
[16] 武春桃. 城镇化对中国农业碳排放的影响−省际数据的实证研究[J]. 经济经纬, 2015, 32(1): 12−18 doi: 10.3969/j.issn.1006-1096.2015.01.003 WU C T. The impact of urbanization on agricultural carbon emissions in China — An empirical study based on provincial data[J]. Economic Survey, 2015, 32(1): 12−18 doi: 10.3969/j.issn.1006-1096.2015.01.003
[17] 董明涛. 我国农业碳排放与产业结构的关联研究[J]. 干旱区资源与环境, 2016, 30(10): 7−12 DONG M T. The association of agricultural carbon emissions and industrial structure in China[J]. Journal of Arid Land Resources and Environment, 2016, 30(10): 7−12
[18] 魏玮, 文长存, 崔琦, 等. 农业技术进步对农业能源使用与碳排放的影响−基于GTAP-E模型分析[J]. 农业技术经济, 2018(2): 30−40 WEI W, WEN C C, CUI Q, et al. The impacts of technological advance on agricultural energy use and carbon emission—an analysis based on GTAP-E model[J]. Journal of Agrotechnical Economics, 2018(2): 30−40
[19] 王惠, 卞艺杰. 农业生产效率、农业碳排放的动态演进与门槛特征[J]. 农业技术经济, 2015(6): 36−47 WANG H, BIAN Y J. Dynamic evolution and threshold characteristics of agricultural production efficiency and agricultural carbon emissions[J]. Journal of Agrotechnical Economics, 2015(6): 36−47
[20] 仇伟, 卢东宁. 基于VAR模型的农业碳排放影响因素及其动态响应机制分析[J]. 湖北农业科学, 2019, 58(24): 271−276 QIU W, LU D N. Analysis of factors affecting agricultural carbon emission based on VAR model and its dynamic response mechanism[J]. Hubei Agricultural Sciences, 2019, 58(24): 271−276
[21] 刘丽辉, 徐军. 基于扩展的STIRPAT模型的广东农业碳排放影响因素分析[J]. 科技管理研究, 2016, 36(6): 250−255 doi: 10.3969/j.issn.1000-7695.2016.06.046 LIU L H, XU J. Analysis of influencing factors of agricultural carbon emission in Guangdong Province with the extended STIRPAT model[J]. Science and Technology Management Research, 2016, 36(6): 250−255 doi: 10.3969/j.issn.1000-7695.2016.06.046
[22] BAI Y P, DENG X Z, JIANG S J, et al. Relationship between climate change and low-carbon agricultural production: a case study in Hebei Province, China[J]. Ecological Indicators, 2019, 105: 438−447 doi: 10.1016/j.ecolind.2018.04.003
[23] 王小彬, 武雪萍, 赵全胜, 等. 中国农业土地利用管理对土壤固碳减排潜力的影响[J]. 中国农业科学, 2011, 44(11): 2284−2293 doi: 10.3864/j.issn.0578-1752.2011.11.010 WANG X B, WU X P, ZHAO Q S, et al. Effects of cropland-use management on potentials of soil carbon sequestration and carbon emission mitigation in China[J]. Scientia Agricultura Sinica, 2011, 44(11): 2284−2293 doi: 10.3864/j.issn.0578-1752.2011.11.010
[24] 冉锦成, 马惠兰, 苏洋. 西北五省农业碳排放测算及碳减排潜力研究[J]. 江西农业大学学报, 2017, 39(3): 623−632 RAN J C, MA H L, SU Y. A study on agricultural carbon emission and carbon emission reduction potential in five provinces in Northwest China[J]. Acta Agriculturae Universitatis Jiangxiensis, 2017, 39(3): 623−632
[25] 周一凡, 李彬, 张润清. 县域尺度下河北省农业碳排放时空演变与影响因素研究[J]. 中国生态农业学报(中英文), 2022, 30(4): 570−581 doi: 10.12357/cjea.20210624 ZHOU Y F, LI B, ZHANG R Q. Spatiotemporal evolution and influencing factors of agricultural carbon emissions in Hebei Province at the County scale[J]. Chinese Journal of Eco-Agriculture, 2022, 30(4): 570−581 doi: 10.12357/cjea.20210624
[26] 刘杨, 刘鸿斌. 山东省农业碳排放特征、影响因素及达峰分析[J]. 中国生态农业学报(中英文), 2022, 30(4): 558−569 doi: 10.12357/cjea.20210582 LIU Y, LIU H B. Characteristics, influence factors, and prediction of agricultural carbon emissions in Shandong Province[J]. Chinese Journal of Eco-Agriculture, 2022, 30(4): 558−569 doi: 10.12357/cjea.20210582
[27] 祝宏辉, 李晓晓. 新疆农业碳排放的脱钩效应及驱动因素分析[J]. 生态经济, 2018, 34(9): 31−35, 115 ZHU H H, LI X X. Analysis of decoupling effect and driving factors of agriculture carbon emission in Xinjiang[J]. Ecological Economy, 2018, 34(9): 31−35, 115
[28] 苏洋, 马惠兰, 李凤. 新疆农牧业碳排放及其与农业经济增长的脱钩关系研究[J]. 干旱区地理, 2014, 37(5): 1047−1054 SU Y, MA H L, LI F. Xinjiang agriculture and animal husbandry carbon emissions and its decoupling relationship with agricultural economic growth[J]. Arid Land Geography, 2014, 37(5): 1047−1054
[29] 冉锦成, 苏洋, 胡金凤, 等. 新疆农业碳排放时空特征、峰值预测及影响因素研究[J]. 中国农业资源与区划, 2017, 38(8): 16−24 doi: 10.7621/cjarrp.1005-9121.20170803 RAN J C, SU Y, HU J F, et al. Temporal and spatial characteristics, peak value forecast and influencing factors of agricultural carbon emissions in Xinjiang[J]. Chinese Journal of Agricultural Resources and Regional Planning, 2017, 38(8): 16−24 doi: 10.7621/cjarrp.1005-9121.20170803
[30] WU X R, ZHANG J B, YOU L Z. Marginal abatement cost of agricultural carbon emissions in China: 1993−2015[J]. China Agricultural Economic Review, 2018, 10(4): 558−571 doi: 10.1108/CAER-04-2017-0063
[31] WEST T O, MARLAND G. A synthesis of carbon sequestration, carbon emissions, and net carbon flux in agriculture: comparing tillage practices in the United States[J]. Agriculture, Ecosystems & Environment, 2002, 91(1/2/3): 217−232
[32] 黄华, 倪鹏, 葛中全. 四川省农业生态系统碳排放测算及影响因素分析[J]. 乐山师范学院学报, 2012, 27(5): 22−25 doi: 10.3969/j.issn.1009-8666.2012.05.009 HUANG H, NI P, GE Z Q. Calculation and influencing factors analysis of carbon emissions from agricultural ecosystems in Sichuan Province[J]. Journal of Leshan Teachers College, 2012, 27(5): 22−25 doi: 10.3969/j.issn.1009-8666.2012.05.009
[33] 吴昊玥, 黄瀚蛟, 何宇, 等. 中国农业碳排放效率测度、空间溢出与影响因素[J]. 中国生态农业学报(中英文), 2021, 29(10): 1762−1773 WU H Y, HUANG H J, HE Y, et al. Measurement, spatial spillover and influencing factors of agricultural carbon emissions efficiency in China[J]. Chinese Journal of Eco-Agriculture, 2021, 29(10): 1762−1773
[34] 刘其涛. 中国农业碳排放效率的区域差异−基于Malmquist-Luenberger指数的实证分析[J]. 江苏农业科学, 2015, 43(9): 497−501 LIU Q T. Regional differences in China’s agricultural carbon emission efficiency: an empirical analysis based on Malmquist-Luenberger index[J]. Jiangsu Agricultural Sciences, 2015, 43(9): 497−501
[35] 张俊飚, 程琳琳, 何可. 中国农业低碳经济效率的时空差异及影响因素研究−基于“碳投入”视角[J]. 环境经济研究, 2017, 2(2): 36−51 ZHANG J B, CHENG L L, HE K. The difference of China’s agricultural low-carbon economic efficiency in spatial and temporal and its influencing factors: a perspective of carbon input[J]. Journal of Environmental Economics, 2017, 2(2): 36−51
[36] 田云, 王梦晨. 湖北省农业碳排放效率时空差异及影响因素[J]. 中国农业科学, 2020, 53(24): 5063−5072 doi: 10.3864/j.issn.0578-1752.2020.24.009 TIAN Y, WANG M C. Research on spatial and temporal difference of agricultural carbon emission efficiency and its influencing factors in Hubei Province[J]. Scientia Agricultura Sinica, 2020, 53(24): 5063−5072 doi: 10.3864/j.issn.0578-1752.2020.24.009
[37] FRANKLIN J. The elements of statistical learning: data mining, inference and prediction[J]. The Mathematical Intelligencer, 2005, 27: 83−85
[38] 张杰. R语言数据可视化之美: 专业图表绘制指南[M]. 北京: 电子工业出版社, 2019 ZHANG J. The Beauty of R Language Data Visualization-professional Chart Drawing Guide[M]. Beijing: Publishing House of Electronics industry, 2019
[39] 赵宇铭, 邱新法, 朱晓晨, 等. 1971—2010年中国干湿区降雨资源变化特征分析[J]. 长江科学院院报, 2019, 36(5): 34−41 ZHAO Y M, QIU X F, ZHU X C, et al. Characteristics of rainfall amount variations in wet and dry partitions of China from 1971 to 2010[J]. Journal of Yangtze River Scientific Research Institute, 2019, 36(5): 34−41
[40] 朱永彬, 马晓哲, 史雅娟. 县级尺度下河南省农业投入产出效率与减排潜力分析[J]. 中国生态农业学报(中英文), 2022, 30(11): 1−11 ZHU Y B, MA X Z, SHI Y J. Agricultural input-output efficiency and the potential reduction of emissions in Henan Province at the county scale[J]. Chinese Journal of Eco-Agriculture, 2022, 30(11): 1−11
[41] 段华平, 张悦, 赵建波, 等. 中国农田生态系统的碳足迹分析[J]. 水土保持学报, 2011, 25(5): 203−208 DUAN H P, ZHANG Y, ZHAO J B, et al. Carbon footprint analysis of farmland ecosystem in China[J]. Journal of Soil and Water Conservation, 2011, 25(5): 203−208
[42] 田成诗, 陈雨. 中国省际农业碳排放测算及低碳化水平评价−基于衍生指标与TOPSIS法的运用[J]. 自然资源学报, 2021, 36(2): 395−410 doi: 10.31497/zrzyxb.20210210 TIAN C S, CHEN Y. China’s provincial agricultural carbon emissions measurement and low carbonization level evaluation: based on the application of derivative indicators and TOPSIS[J]. Journal of Natural Resources, 2021, 36(2): 395−410 doi: 10.31497/zrzyxb.20210210
[43] 田云, 张俊飚, 尹朝静, 等. 中国农业碳排放分布动态与趋势演进−基于31个省(市、区) 2002—2011年的面板数据分析[J]. 中国人口·资源与环境, 2014, 24(7): 91−98 TIAN Y, ZHANG J B, YIN C J, et al. Distributional dynamics and trend evolution of China’s agricultural carbon emissions — An analysis on panel data of 31 provinces from 2002 to 2011[J]. China Population, Resources and Environment, 2014, 24(7): 91−98
[44] 何艳秋, 陈柔, 吴昊玥, 等. 中国农业碳排放空间格局及影响因素动态研究[J]. 中国生态农业学报, 2018, 26(9): 1269−1282 HE Y Q, CHEN R, WU H Y, et al. Spatial dynamics of agricultural carbon emissions in China and the related driving factors[J]. Chinese Journal of Eco-Agriculture, 2018, 26(9): 1269−1282
[45] 胡婉玲, 张金鑫, 王红玲. 中国农业碳排放特征及影响因素研究[J]. 统计与决策, 2020, 36(5): 56−62 HU W L, ZHANG J X, WANG H L. Characteristics and influencing factors of agricultural carbon emission in China[J]. Statistics & Decision, 2020, 36(5): 56−62
[46] 张广胜, 王珊珊. 中国农业碳排放的结构、效率及其决定机制[J]. 农业经济问题, 2014, 35(7): 18−26, 110 ZHANG G S, WANG S S. China’s agricultural carbon emission: structure, efficiency and its determinants[J]. Issues in Agricultural Economy, 2014, 35(7): 18−26, 110
[47] 孟军, 范婷婷. 黑龙江省农业碳排放动态变化影响因素分析[J]. 生态经济, 2020, 36(12): 34−39 MENG J, FAN T T. Research on affecting factors decomposition of agricultural CO2 emission in Heilongjiang Province[J]. Ecological Economy, 2020, 36(12): 34−39
-
期刊类型引用(27)
1. 王艺霖,梁尧,蔡红光,徐康宁,张水梅,张畅,范围,袁静超,刘剑钊,任军. 基于最小数据集的不同有机物料还田黑土土壤质量评价. 土壤通报. 2024(01): 68-75 .  百度学术
百度学术
2. 李传福,徐家林,明玉飞,高舒,吕欣,杨宇轩,李永强,焦树英. 菇渣有机肥配施脱硫石膏对黄河三角洲盐碱土活性有机碳及其敏感性的影响. 水土保持学报. 2024(02): 387-397 .  百度学术
百度学术
3. 李如欣,高其松,于迎鑫,吕艺,韩惠芳. 耕作方式对土壤中微生物残体的影响研究进展. 福建农业学报. 2024(02): 237-242 .  百度学术
百度学术
4. 李文慧,陈浩楠,南雄雄,林妍敏,王芳. 宁夏旱区枸杞/覆盖作物种植体系对土壤活性有机碳库的影响. 生态学杂志. 2024(05): 1324-1332 .  百度学术
百度学术
5. 刘雅杰,张天娇,张向前,路战远,刘战勇,程玉臣,武迪,李金龙. 秸秆还田下耕作方式对黑土活性有机碳组分及碳库管理指数的影响. 中国农业科学. 2024(17): 3408-3423 .  百度学术
百度学术
6. 张海星,赵智强,王瑞锋,刘静,楚天舒. 长江中下游地区耕地土壤有机碳密度变化率驱动因素. 农业工程学报. 2023(09): 112-122 .  百度学术
百度学术
7. 李铠妍,邓兰生. 有机无机肥施用方式对土壤碳固存的影响. 耕作与栽培. 2023(04): 1-5+16 .  百度学术
百度学术
8. 伍海兵,马想,梁晶. 厨余垃圾沼渣堆肥与化学改良剂对城市搬迁地土壤团聚体形成的影响. 土壤. 2023(04): 911-917 .  百度学术
百度学术
9. 陈国徽,张颂,陈艳芳,高冰可,车品高,应治宏,陈俊松,杜红霞,吕淑珍,曹国军. 长江流域油—稻轮作区不同肥料运筹对土壤理化性质和油菜产量的影响. 江西农业学报. 2023(08): 106-111 .  百度学术
百度学术
10. 董林林,查金芳,沈明星,王海候,施林林,陶玥玥,周新伟,陆长婴. 长期秸秆还田对稻麦轮作区土壤有机碳组分构成的影响. 中国农业科技导报. 2022(03): 166-175 .  百度学术
百度学术
11. 徐高明,汪小旵,何瑞银,丁启朔. 基于复合指标与测试技术的旋耕秸秆还田质量评价研究. 农业机械学报. 2022(02): 58-67 .  百度学术
百度学术
12. 何京,王津军,尹兴盛,吴宗海,沈广材,赵旭辉,刘洪华,李丽,曹娜,丛萍. 深耕配施有机肥对云南保山植烟土壤肥力的快速提升效应. 中国烟草科学. 2022(01): 27-34 .  百度学术
百度学术
13. 王苗苗,王恩姮,韩明钊,李永江,玉苏普. 外源有机物料提升农田黑土抗机械扰动能力研究. 土壤通报. 2022(02): 341-348 .  百度学术
百度学术
14. 李传哲,姚文静,杨苏,徐聪,马洪波,吴建燕,汪吉东,艾玉春,张永春. 有机物料输入对黄河故道区土壤物理结构的影响. 江苏农业科学. 2022(16): 245-250 .  百度学术
百度学术
15. 范雅琦,王亚南,霍瑞轩,姚涛,杨珍平,乔月静,郭来春. 轮作模式下土壤微生物与线虫群落的互作研究现状. 中国农学通报. 2022(25): 108-113 .  百度学术
百度学术
16. 张志毅,何剑,范先鹏,夏颖,张富林,刘冬碧,吴茂前. 稻麦轮作制还田秸秆腐解和养分释放特征. 中国土壤与肥料. 2022(08): 221-230 .  百度学术
百度学术
17. 郑凤君,王雪,李生平,刘晓彤,刘志平,卢晋晶,武雪萍,席吉龙,张建诚,李永山. 免耕覆盖下土壤水分、团聚体稳定性及其有机碳分布对小麦产量的协同效应. 中国农业科学. 2021(03): 596-607 .  百度学术
百度学术
18. 郑佳舜,胡钧铭,韦翔华,韦燕燕,苏世鸣,李婷婷,夏旭,俞月凤,张俊辉. 绿肥压青对粉垄稻田土壤微生物量碳和有机碳累积矿化量的影响. 中国生态农业学报(中英文). 2021(04): 691-703 .  本站查看
本站查看
19. 万佳淼,原秦英,李东利,周喜荣,刘智,田超,刘少泉,孙权. 奶牛粪肥对玉米光合特性、产量及经济效益的影响. 江苏农业科学. 2021(07): 95-100 .  百度学术
百度学术
20. 吕奕彤,于爱忠,吕汉强,王玉珑,苏向向,柴强. 绿洲灌区玉米农田土壤团聚体组成及其稳定性对绿肥还田方式的响应. 中国生态农业学报(中英文). 2021(07): 1194-1204 .  本站查看
本站查看
21. 逄娜,程松,张水梅,袁静超,刘剑钊,刘松涛,任军,梁尧,蔡红光. 化肥配施有机肥对黑土肥力与春玉米产量的影响. 华北农学报. 2021(04): 124-131 .  百度学术
百度学术
22. 马尚宇,侯君佑,王艳艳,黄正来,张文静,樊永惠,马元山. 稻麦轮作系统无机氮肥高效利用研究进展. 土壤通报. 2021(06): 1496-1504 .  百度学术
百度学术
23. 甘磊,邓婉珍,陶涣壮,李帅,陈廷速,张建兵. 秸秆覆盖对广西甘蔗地土壤水分变化的影响. 南方农业学报. 2021(09): 2438-2446 .  百度学术
百度学术
24. 刘学彤,郑春莲,曹彩云,党红凯,马俊永,李科江. 长期秸秆还田对潮土水稳性团聚体的影响. 江苏农业科学. 2021(24): 215-220 .  百度学术
百度学术
25. 安嫄嫄,马琨,王明国,马占旗. 玉米秸秆还田对土壤团聚体组成及其碳氮分布的影响. 西北农业学报. 2020(05): 766-775 .  百度学术
百度学术
26. 石丽红,唐海明,程凯凯,肖小平,李超,董春华,李万明,罗尊长. 绿色生产健康农田土壤培育措施若干思考. 湖南农业科学. 2020(05): 48-50+54 .  百度学术
百度学术
27. 陈晨,红梅,张月鲜,温馨,裴志福,赵卉鑫,李二珍. 有机物料添加对内蒙古河套灌区碱化土壤可溶性有机碳的影响. 水土保持学报. 2020(06): 331-336 .  百度学术
百度学术
其他类型引用(30)


 下载:
下载:


