
Comparison of the applicability of phenological models in major maize production areas in China
-
摘要: 发育模式是预测作物发育对气候变化响应的主要工具。模式在变暖环境下的适用性对作物产量评估有重要影响。本研究比较了机器学习算法(多层感知器神经网络, MLP)以及3个机理发育模式[MAIS (maize simulation)、Beta和耦合响应与适应机制的模式(RAM)]在变暖环境下的适用性。选择东北春玉米和华北夏玉米具有20年以上物候观测的站点, 使用发育期资料及同期的逐日气象数据, 按生长季均温异常度, 将观测年份划分为冷、暖年。冷年数据用于率定模式参数, 暖年数据用于验证变暖环境下模式的表现。根据冷暖年表现的差异评价模式在变暖情景下的适用性。评价指标包括归一化均方根误差(NRMSE)、平均偏差(MBE)和模拟误差随发育阶段均温的趋势。结果表明: 在冷年校正时, MLP的模拟精度明显高于机理发育模式, 机理发育模式中RAM表现最优, 其次是Beta和MAIS。MAIS和Beta模拟值略早于观测值, 而RAM和MLP普遍迟于观测值。机理发育模式的误差随发育阶段均温有显著趋势的站点比例明显低于MLP, 3个机理发育模式中, Beta有显著趋势的站点比例最小, 其次是RAM和MAIS。在变暖情景下进行验证, Beta模拟精度表现最好, 其次是MLP和RAM, MAIS表现较差。3个机理发育模式模拟值早于观测值, 而MLP迟于观测值。除MLP以外的模式模拟误差随发育阶段均温有显著趋势的站点比例较冷年均增大。4个模式中Beta有显著趋势的站点比例最小, 其次是MLP、MAIS和RAM。整体来看, 没有一个模式在校正和验证阶段均全面占优, MLP虽然冷年校正时最优, 但暖年表现较差, 而机理发育模式虽然冷年校正时不是最优, 但暖年验证时表现较好。本研究认为, 不同模式有不同的适用场景, 关注准确反演历史气候变化对发育期影响时, 建议采用MLP, 而关注准确预测未来气候变化对发育期影响时, 应以机理发育模式为主。Abstract: Crop growth simulation models are the primary instrument used for predicting crop developmental responses to climate change. The understanding of the applicability of phenological models is critical for measuring how climate change affects crop yields, particularly under warm climate conditions. Machine learning algorithm (MLP), maize simulation model (MAIS), response and adaption model (RAM), and Beta model (Beta) in warm climate were compared in this study. Based on phenological observation data of over 20 years for spring maize in Northeast China and summer maize in North China from agricultural meteorological station records and daily weather data, we separated the data into two categories: cold and warm years. Data were obtained by calculating the abnormality based on the mean temperature during the maize growing season. Cold years data were used to calibrate the models, and warm years data were used to validate them and subsequently evaluate their performance. The normalized root mean square error (NRMSE), mean bias error (MBE), and systematic bias of the simulation error against the average temperature of the growth period were used to evaluate the deviation between the simulated and observed maize phenology of the four models. The results showed that MLP performed much better than the three mechanistic phenology models during cold years. RAM outperformed the other mechanistic phenology models, followed by Beta and MAIS models. Our results indicated that the dates of MAIS and Beta were earlier than the observations, whereas the simulations of RAM and MLP were later than the observations. The proportion of sites with a significant trend of simulation error against the average temperature of the growth period for the RAM, MAIS, and Beta models was lower than that for MLP. Compared to that for MAIS and RAM, the proportion of sites with a significant trend for Beta was the smallest. In warm years, Beta performed better than the other models, followed by MLP, RAM, and MAIS. The simulations of the three mechanistic phenology models were earlier than the observations, but the simulations of MLP were later than the observations. Beta showed the smallest proportion of sites with a significant trend, followed by MLP, MAIS, and RAM. Overall, the models did not benefit from both calibration and validation. MLP performed well during calibration in cold years, but poorly in warm years. The overall performance of the mechanistic phenology models was worse than that of MLP in cold years, but they performed better in warm years. Different models are appropriate in various contexts. The MLP can be recommended to precisely reverse the impact of historical climate change on growth period. However, mechanistic models should be used to precisely predict the impact of future climate change on growth period.
-
Keywords:
- Phenology /
- Mechanistic phenology model /
- Machine learning /
- Climate warming /
- Maize
-
-
![]()
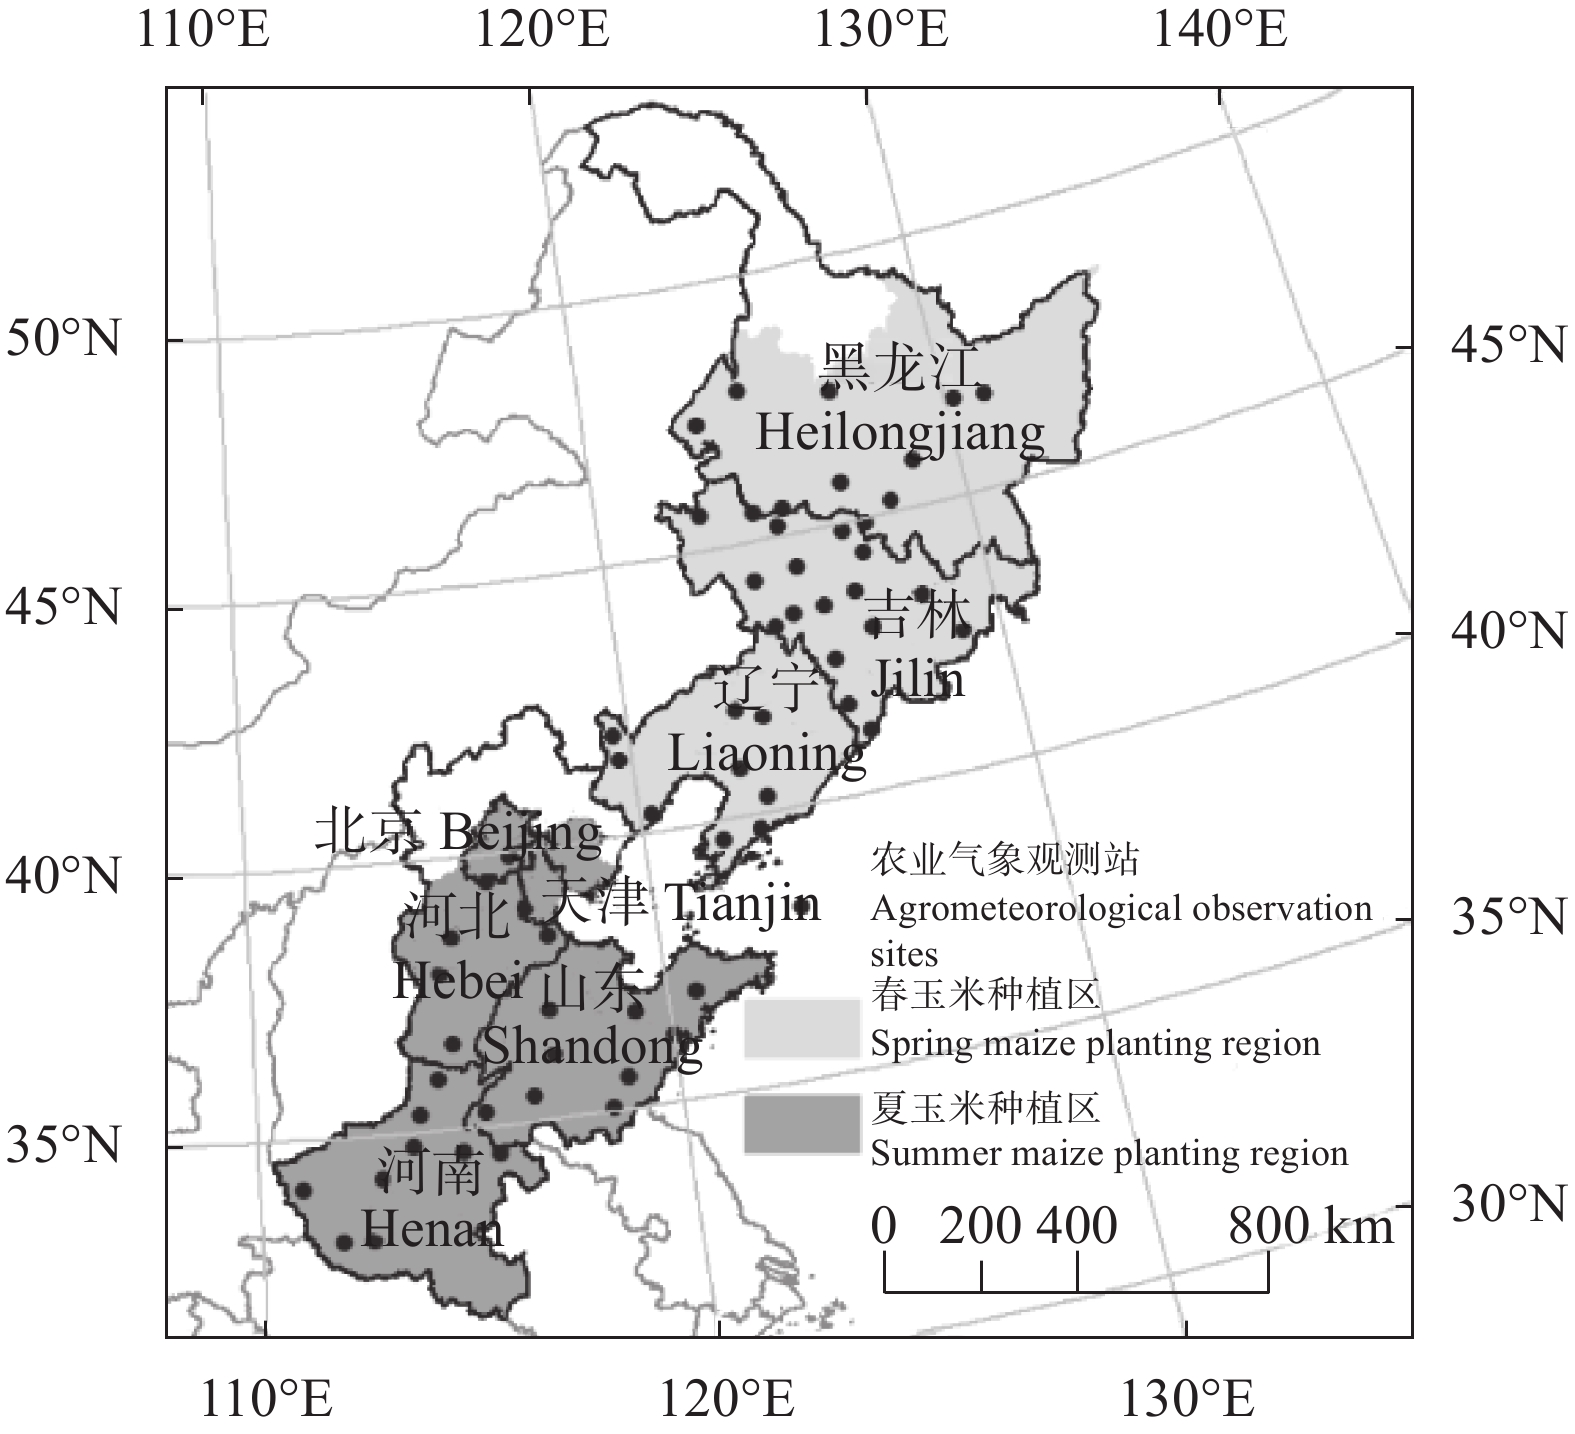
图 1 研究区域和农业气象站点的分布
Figure 1. Study area and location of agrometeorological observation sites
![]()
图 2 不同发育模式冷年模拟发育期的归一化均方根误差(a: 春玉米营养生长阶段; b: 春玉米生殖生长阶段; c: 夏玉米营养生长阶段; d: 夏玉米生殖生长阶段)
箱体实线从上至下分别为上边缘、上四分位数、中位数、下四分位数、下边缘, 方框中的空心方块是平均值。空心圆表示异常值, 下、上边缘的“$ \times $”分别是第1个和第99个百分位数。From top to bottom, solid lines in boxplots represent the maximum, the 1st quantile, the median, the 3rd quantile and the minimum, and open square in the box is the mean. The open circles represent the outliers, “$ \times $” symbols below and above the whiskers are the 1st and 99th percentiles, respectively.
Figure 2. Normalized root mean square error of simulated maize growth period of different phenological models in cold years. a: vegetative growth period (VGP) of spring maize; b: reproductive growth period (RGP) of spring maize; c: VGP of summer maize; d: RGP of summer maize.
![]()
图 3 不同发育模式冷年模拟发育期的平均偏差(a: 春玉米营养生长阶段; b: 春玉米生殖生长阶段; c: 夏玉米营养生长阶段; d: 夏玉米生殖生长阶段)
箱体实线从上至下分别为上边缘、上四分位数、中位数、下四分位数、下边缘, 方框中的空心方块是平均值。空心圆表示异常值, 下、上边缘的“$ \times $”分别是第1个和第99个百分位数。From top to bottom, solid lines in boxplots represent the maximum, the 1st quantile, the median, the 3rd quantile and the minimum, and open square in the box is the mean. The open circles represent the outliers, “$ \times $” symbols below and above the whiskers are the 1st and 99th percentiles, respectively.
Figure 3. Mean bias error of simulated growth period of different phenological models in cold years. a: vegetative growth period (VGP) of spring maize; b: reproductive growth period (RGP) of spring maize; c: VGP of summer maize; d: RGP of summer maize.
![]()
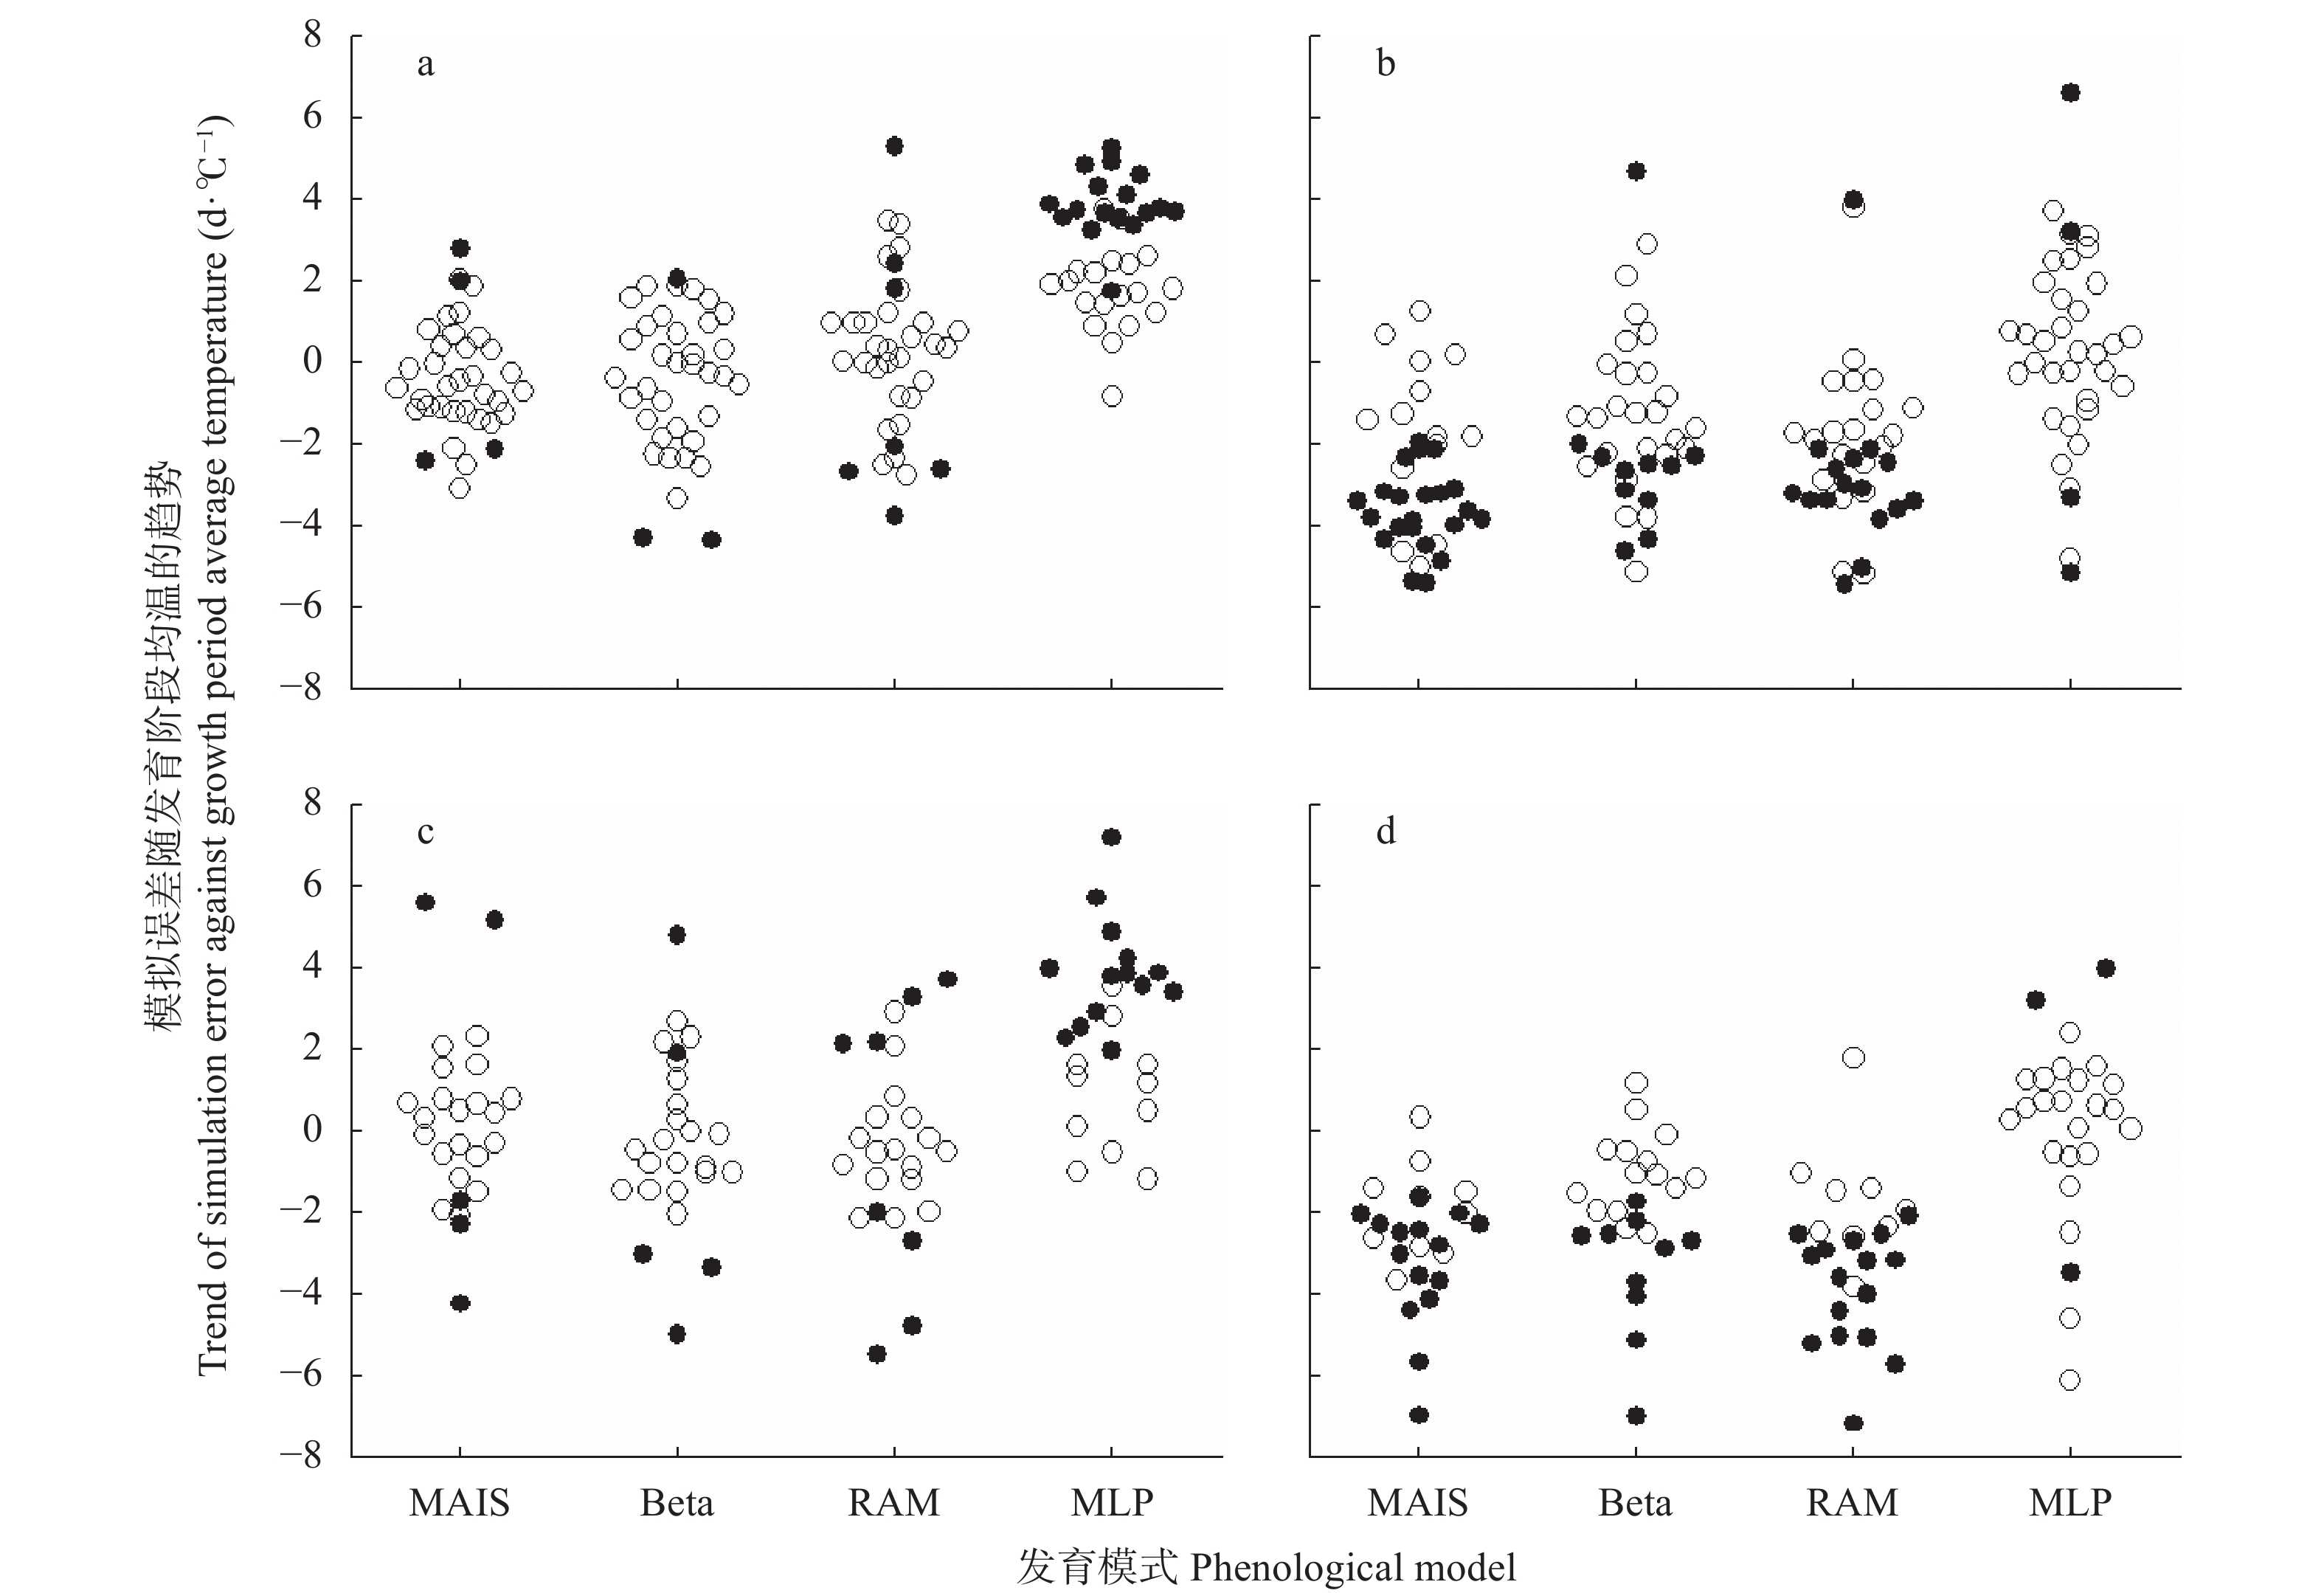
图 4 不同发育模式在冷年模拟时的模拟误差随发育阶段均温的趋势[a: 春玉米营养生长阶段; b: 春玉米生殖生长阶段; c: 夏玉米营养生长阶段; d: 夏玉米生殖生长阶段。实心点为站点趋势显著(P<0.05)]
Figure 4. Trend of simulation error against growth period average temperature of different phenological models in cold years. a: vegetative growth period (VGP) of spring maize; b: reproductive growth period (RGP) of spring maize; c: VGP of summer maize; d: RGP of summer maize. Solid point indicate the trends are statistically significant at P<0.05 level.
![]()
图 5 不同发育模式暖年模拟发育期的归一化均方根误差(a: 春玉米营养生长阶段; b: 春玉米生殖生长阶段; c: 夏玉米营养生长阶段; d: 夏玉米生殖生长阶段)
箱体实线从上至下分别为上边缘、上四分位数、中位数、下四分位数、下边缘, 方框中的空心方块是平均值。空心圆表示异常值, 下、上边缘的“$ \times $”分别是第1个和第99个百分位数。From top to bottom, solid lines in boxplots represent the maximum, the 1st quantile, the median, the 3rd quantile and the minimum, and open square in the box is the mean. The open circles represent the outliers, “$ \times $” symbols below and above the whiskers are the 1st and 99th percentiles, respectively.
Figure 5. Normalized root mean square error of simulated growth period of different phenological models in warm years. a: vegetative growth period (VGP) of spring maize; b: reproductive growth period (RGP) of spring maize; c: VGP of summer maize; d: RGP of summer maize.
![]()
图 6 不同发育模式暖年模拟发育期的平均偏差(a: 春玉米营养生长阶段; b: 春玉米生殖生长阶段; c: 夏玉米营养生长阶段; d: 夏玉米生殖生长阶段)
箱体实线从上至下分别为上边缘、上四分位数、中位数、下四分位数、下边缘, 方框中的空心方块是平均值。空心圆表示异常值, 下、上边缘的“$ \times $”分别是第1个和第99个百分位数。From top to bottom, solid lines in boxplots represent the maximum, the 1st quantile, the median, the 3rd quantile and the minimum, and open square in the box is the mean. The open circles represent the outliers, “$ \times $” symbols below and above the whiskers are the 1st and 99th percentiles, respectively.
Figure 6. Mean bias error of simulated growth period of different phenological models in warm years. a: vegetative growth period (VGP) of spring maize; b: reproductive growth period (RGP) of spring maize; c: VGP of summer maize; d: RGP of summer maize.
![]()
图 7 不同发育模式暖年模拟时的模拟误差随发育阶段均温的趋势。a: 春玉米营养生长阶段; b: 春玉米生殖生长阶段; c: 夏玉米营养生长阶段; d: 夏玉米生殖生长阶段。实心点为站点趋势显著(P<0.05)。
Figure 7. Trend of simulation error against growth period average temperature of different phenological models in warm years. a: vegetative growth period (VGP) of spring maize; b: reproductive growth period (RGP) of spring maize; c: VGP of summer maize; d: RGP of summer maize. Solid point indicate the trends are statistically significant at P<0.05 level.
表 1 发育模式参数/超参数取值范围
Table 1 Parameter / hyperparameter value range of phenological models
模式 Model 阶段 Period 参数/超参数名称 Parameter / hyperparameter 取值范围 Range of value 步长 Loop step MAIS VGP, RGP 热时 Thermal time (GTI) 300~1000 10 Beta VGP, RGP 基本发育系数 Basic duration coefficient (K) 3~5 0.25 增温促进系数 Thermal sensitivity coefficient (P) 0.01~3 0.1 VGP 感光性系数 Photoperiod sensitivity coefficient (G ) 0~0.5 0.02 MLP VGP, RGP 隐藏层大小 Hidden layer size (hidden_layer_sizes) 25~125 25 最大迭代次数 Maximum iteration (max_iter) 300~1500 50 随机种子 Random seed (random_state) 0~9 1 VGP: 营养生长阶段; RGP: 生殖生长阶段。VGP: vegetative growth period; RGP: reproductive growth period.  下载: 导出CSV
-
[1] Intergovernmental Panel on Climate Chang. Climate change 2021 — the physical science basis[J]. Chemistry International, 2021, 43(4): 22−23 doi: 10.1515/ci-2021-0407
[2] DING Y H, REN G Y, SHI G Y, et al. China’s national assessment report on climate change (Ⅰ): climate change in China and the future trend[J]. Advances in Climate Change Research, 2007, 3(Suppl.): S1−S5
[3] STEWART D W, DWYER L M, CARRIGAN L L. Phenological temperature response of maize[J]. Agronomy Journal, 1998, 90(1): 73−79 doi: 10.2134/agronj1998.00021962009000010014x
[4] KUMUDINI S, ANDRADE F H, BOOTE K J, et al. Predicting maize phenology: intercomparison of functions for developmental response to temperature[J]. Agronomy Journal, 2014, 106(6): 2087−2097 doi: 10.2134/agronj14.0200
[5] SOLTANI A, HAMMER G L, TORABI B, et al. Modeling chickpea growth and development: Phenological development[J]. Field Crops Research, 2006, 99(1): 1−13 doi: 10.1016/j.fcr.2006.02.004
[6] 郑国清, 高亮之. 玉米发育期动态模拟模型[J]. 江苏农业学报, 2000, 16(1): 15−21 doi: 10.3969/j.issn.1000-4440.2000.01.003 ZHENG G Q, GAO L Z. Simulation model of maize phenology[J]. Jiangsu Journal of Agricultural Sciences, 2000, 16(1): 15−21 doi: 10.3969/j.issn.1000-4440.2000.01.003
[7] 冯利平, 高亮之, 金之庆, 等. 小麦发育期动态模拟模型的研究[J]. 作物学报, 1997, 23(4): 418−424 doi: 10.3321/j.issn:0496-3490.1997.04.005 FENG L P, GAO L Z, JIN Z Q, et al. Studies on the simulation model for wheat phenology[J]. Acta Agronomica Sinica, 1997, 23(4): 418−424 doi: 10.3321/j.issn:0496-3490.1997.04.005
[8] SPRINGER C J, WARD J K. Flowering time and elevated atmospheric CO2[J]. The New Phytologist, 2007, 176(2): 243−255 doi: 10.1111/j.1469-8137.2007.02196.x
[9] 戴建军, 常缨, 张美萍, 等. 甜菜幼苗低温和长日照诱导表达基因的克隆和序列分析[J]. 中国农业科学, 2005, 38(9): 1856−1862 doi: 10.3321/j.issn:0578-1752.2005.09.021 DAI J J, CHANG Y, ZHANG M P, et al. Cloning and sequence analysis of cold and longday induced expressed genes from sugar beet (Beta vulgaris L.) seedlings[J]. Scientia Agricultura Sinica, 2005, 38(9): 1856−1862 doi: 10.3321/j.issn:0578-1752.2005.09.021
[10] 刘健, 姚宁, 吝海霞, 等. 冬小麦物候期对土壤水分胁迫的响应机制与模拟[J]. 农业工程学报, 2016, 32(21): 115−124 doi: 10.11975/j.issn.1002-6819.2016.21.016 LIU J, YAO N, LIN H X, et al. Response mechanism and simulation of winter wheat phonology to soil water stress[J]. Transactions of the Chinese Society of Agricultural Engineering, 2016, 32(21): 115−124 doi: 10.11975/j.issn.1002-6819.2016.21.016
[11] 严美春, 曹卫星, 李存东, 等. 小麦发育过程及生育期机理模型的检验和评价[J]. 中国农业科学, 2000, 33(2): 43−50 doi: 10.3321/j.issn:0578-1752.2000.02.007 YAN M C, CAO W X, LI C D, et al. Validation and evaluation of a mechanistic model of phasic and phenological development of wheat[J]. Scientia Agricultura Sinica, 2000, 33(2): 43−50 doi: 10.3321/j.issn:0578-1752.2000.02.007
[12] WU D R, WANG P J, JIANG C Y, et al. Use of a plastic temperature response function reduces simulation error of crop maturity date by half[J]. Agricultural and Forest Meteorology, 2020, 280: 107770 doi: 10.1016/j.agrformet.2019.107770
[13] WU D R, HUO Z G, WANG P J, et al. Plastic temperature response function accurately simulates crop flowering or heading date[J]. Agronomy Journal, 2020, 112(5): 3832−3846 doi: 10.1002/agj2.20112
[14] YUE Y, LI J H, FAN L F, et al. Prediction of maize growth stages based on deep learning[J]. Computers and Electronics in Agriculture, 2020, 172: 105351 doi: 10.1016/j.compag.2020.105351
[15] CAPINHA C. Predicting the timing of ecological phenomena using dates of species occurrence records: a methodological approach and test case with mushrooms[J]. International Journal of Biometeorology, 2019, 63(8): 1015−1024 doi: 10.1007/s00484-019-01714-0
[16] CZERNECKI B, NOWOSAD J, JABŁOŃSKA K. Machine learning modeling of plant phenology based on coupling satellite and gridded meteorological dataset[J]. International Journal of Biometeorology, 2018, 62(7): 1297−1309 doi: 10.1007/s00484-018-1534-2
[17] BELDA S, PIPIA L, MORCILLO-PALLARÉS P, et al. DATimeS: a machine learning time series GUI toolbox for gap-filling and vegetation phenology trends detection[J]. Environmental Modelling & Software, 2020, 127: 104666
[18] HOFFMAN A L, KEMANIAN A R, FOREST C E. The response of maize, sorghum, and soybean yield to growing-phase climate revealed with machine learning[J]. Environmental Research Letters, 2020, 15(9): 094013 doi: 10.1088/1748-9326/ab7b22
[19] DAI W J, JIN H Y, ZHANG Y H, et al. Detecting temporal changes in the temperature sensitivity of spring phenology with global warming: application of machine learning in phenological model[J]. Agricultural and Forest Meteorology, 2019, 279: 107702 doi: 10.1016/j.agrformet.2019.107702
[20] 杨鹏宇, 胡琦, 马雪晴, 等. 1961—2015年华北平原夏玉米生长季光热资源变化及其影响[J]. 中国农业气象, 2018, 39(7): 431−441 doi: 10.3969/j.issn.1000-6362.2018.07.001 YANG P Y, HU Q, MA X Q, et al. Spatiotemporal variation of heat and solar resources and its impact on summer maize in the North China Plain over the period 1961−2015[J]. Chinese Journal of Agrometeorology, 2018, 39(7): 431−441 doi: 10.3969/j.issn.1000-6362.2018.07.001
[21] WANG N, WANG J, WANG E L, et al. Increased uncertainty in simulated maize phenology with more frequent supra-optimal temperature under climate warming[J]. European Journal of Agronomy, 2015, 71: 19−33 doi: 10.1016/j.eja.2015.08.005
[22] 李荣平, 周广胜, 王笑影, 等. 不同物候模型对东北地区作物发育期模拟对比分析[J]. 气象与环境学报, 2012, 28(3): 25−30 doi: 10.3969/j.issn.1673-503X.2012.03.005 LI R P, ZHOU G S, WANG X Y, et al. Comparative analysis of simulation on crop development stage using different phenological models in Northeast China[J]. Journal of Meteorology and Environment, 2012, 28(3): 25−30 doi: 10.3969/j.issn.1673-503X.2012.03.005
[23] GAO L Z, JIN Z Q, HUANG Y, et al. Rice clock model — a computer model to simulate rice development[J]. Agricultural and Forest Meteorology, 1992, 60(1/2): 1−16
[24] 乌玲瑛, 徐奂, 蔡喨喨, 等. 基于机器学习的水稻发育期预测模型构建[J]. 扬州大学学报(农业与生命科学版), 2012, 33(3): 44−50 WU L Y, XU H, CAI L L, et al. A predicting model based on machine learning for rice development[J]. Journal of Yangzhou University (Agricultural and Life Science Edition), 2012, 33(3): 44−50
[25] XIN Q C, LI J, LI Z M, et al. Evaluations and comparisons of rule-based and machine-learning-based methods to retrieve satellite-based vegetation phenology using MODIS and USA National Phenology Network data[J]. International Journal of Applied Earth Observation and Geoinformation, 2020, 93: 102189 doi: 10.1016/j.jag.2020.102189
[26] 郑国清. 浅论对水稻发育期模型的认识[J]. 中国农业气象, 1999, 20(2): 31−34 ZHENG G Q. On the simulation models for rice development[J]. Agricultural Meteorology, 1999, 20(2): 31−34
[27] JONES C A, KINIRY J R. CERES-Maize: A Simulation Model of Maize Growth and Development[M]. Texas: Texas A&M University Press, 1986: 67
[28] 王占彪, 王猛, 尹小刚, 等. 气候变化背景下华北平原夏玉米各生育期水热时空变化特征[J]. 中国生态农业学报, 2015, 23(4): 473−481 WANG Z B, WANG M, YIN X G, et al. Spatiotemporal characteristics of heat and rainfall changes in summer maize season under climate change in the North China Plain[J]. Chinese Journal of Eco-Agriculture, 2015, 23(4): 473−481
[29] 冯灵芝, 熊伟, 居辉, 等. RCP情景下长江中下游地区水稻生育期内高温事件的变化特征[J]. 中国农业气象, 2015, 36(4): 383−392 doi: 10.3969/j.issn.1000-6362.2015.04.002 FENG L Z, XIONG W, JU H, et al. Changes of high temperature events during rice growth period in MLRYR under RCP scenarios[J]. Chinese Journal of Agrometeorology, 2015, 36(4): 383−392 doi: 10.3969/j.issn.1000-6362.2015.04.002
[30] 冶明珠, 郭建平, 袁彬, 等. 气候变化背景下东北地区热量资源及玉米温度适宜度[J]. 应用生态学报, 2012, 23(10): 2786−2794 YE M Z, GUO J P, YUAN B, et al. Thermal resources and maize temperature suitability in Northeast China under climate change[J]. Chinese Journal of Applied Ecology, 2012, 23(10): 2786−2794
[31] 栾青, 郭建平, 马雅丽, 等. 基于线性生长假设的作物积温模型稳定性比较[J]. 中国农业气象, 2020, 41(11): 695−706 doi: 10.3969/j.issn.1000-6362.2020.11.002 LUAN Q, GUO J P, MA Y L, et al. Comparison of model’s stability about integrated temperature based on linear hypotheses[J]. Chinese Journal of Agrometeorology, 2020, 41(11): 695−706 doi: 10.3969/j.issn.1000-6362.2020.11.002
[32] 马雪晴, 胡琦, 潘学标, 等. 1961—2015年华北平原夏玉米生长季气候年型及其影响分析[J]. 中国农业气象, 2019, 40(2): 65−75 doi: 10.3969/j.issn.1000-6362.2019.02.001 MA X Q, HU Q, PAN X B, et al. Analysis of annual climate types and its impact on summer maize in the North China Plain over the period 1961−2015[J]. Chinese Journal of Agrometeorology, 2019, 40(2): 65−75 doi: 10.3969/j.issn.1000-6362.2019.02.001
[33] 国家质量监督检验检疫总局, 中国国家标准化管理委员会. 农业气候影响评价: 农作物气候年型划分方法: GB/T 21986—2008[S]. 北京: 中国标准出版社, 2008 State General Administration of the People’s Republic of China for Quality Supervision and Inspection and Quarantine, Standardization Administration of the People’s Republic of China. Assessment of Agroclimate Impact: Classification Method of Annual Crop Climate Types: GB/T 21986—2008[S]. Beijing: China Standards Press, 2008
[34] 陈长青, 类成霞, 王春春, 等. 气候变暖下东北地区春玉米生产潜力变化分析[J]. 地理科学, 2011, 31(10): 1272−1279 CHEN C Q, LEI C X, WANG C C, et al. Changes of spring maize potential productivity under the background of global warming in Northeast China[J]. Scientia Geographica Sinica, 2011, 31(10): 1272−1279
[35] 孙义欣, 冯娜. 穷举法在程序设计中的应用[J]. 计算机时代, 2012(8): 50−52 doi: 10.3969/j.issn.1006-8228.2012.08.020 SUN Y X, FENG N. Application of exhaustion method in programming[J]. Computer Era, 2012(8): 50−52 doi: 10.3969/j.issn.1006-8228.2012.08.020
[36] WU L, FENG L P, ZHANG Y, et al. Comparison of five wheat models simulating phenology under different sowing dates and varieties[J]. Agronomy Journal, 2017, 109(4): 1280−1293 doi: 10.2134/agronj2016.10.0619
[37] 徐春萌, 田芷源, 陈威, 等. 基于DSSAT作物模型的中美大豆主产区单产模拟与验证[J]. 农业工程学报, 2021, 37(3): 132−139 doi: 10.11975/j.issn.1002-6819.2021.03.016 XU C M, TIAN Z Y, CHEN W, et al. Simulations and validations of the soybean yields per unit area using DSSAT crop model in the major soybean producing areas of China and America[J]. Transactions of the Chinese Society of Agricultural Engineering, 2021, 37(3): 132−139 doi: 10.11975/j.issn.1002-6819.2021.03.016
[38] LIU Y, WANG E L, YANG X G, et al. Contributions of climatic and crop varietal changes to crop production in the North China Plain, since 1980s[J]. Global Change Biology, 2009, 16: 2287−2299 doi: 10.1111/j.1365-2486.2009.02077.x
[39] TAO F L, ZHANG S, ZHANG Z, et al. Maize growing duration was prolonged across China in the past three decades under the combined effects of temperature, agronomic management, and cultivar shift[J]. Global Change Biology, 2014, 20(12): 3686−3699 doi: 10.1111/gcb.12684
[40] 李树岩, 王靖, 余卫东, 等. 气候变化对河南省夏玉米主栽品种发育期的影响模拟[J]. 中国农业气象, 2015, 36(4): 479−488 doi: 10.3969/j.issn.1000-6362.2015.04.012 LI S Y, WANG J, YU W D, et al. Modelling the impacts of climate change on phenology of representative maize varieties in Henan Province[J]. Chinese Journal of Agrometeorology, 2015, 36(4): 479−488 doi: 10.3969/j.issn.1000-6362.2015.04.012
[41] WU D R, WANG P J, JIANG C Y, et al. Measured phenology response of unchanged crop varieties to long-term historical climate change[J]. International Journal of Plant Production, 2019, 13(1): 47−58 doi: 10.1007/s42106-018-0033-z
[42] ZHANG S, TAO F L. Modeling the response of rice phenology to climate change and variability in different climatic zones: comparisons of five models[J]. European Journal of Agronomy, 2013, 45: 165−176 doi: 10.1016/j.eja.2012.10.005
[43] ZHANG S, TAO F L. Improving rice development and phenology prediction across contrasting climate zones of China[J]. Agricultural and Forest Meteorology, 2019, 268: 224−233 doi: 10.1016/j.agrformet.2019.01.019
[44] 肖登攀, 齐永青, 王仁德, 等. 1981—2009年新疆小麦和玉米物候期与气候条件变化研究[J]. 干旱地区农业研究, 2015, 33(6): 189−194, 202 doi: 10.7606/j.issn.1000-7601.2015.06.32 XIAO D P, QI Y Q, WANG R D, et al. Changes in phenology and climatic conditions of wheat and maize in Xinjiang during 1981−2009[J]. Agricultural Research in the Arid Areas, 2015, 33(6): 189−194, 202 doi: 10.7606/j.issn.1000-7601.2015.06.32
[45] 李正国, 杨鹏, 唐华俊, 等. 气候变化背景下东北三省主要作物典型物候期变化趋势分析[J]. 中国农业科学, 2011, 44(20): 4180−4189 LI Z G, YANG P, TANG H J, et al. Trend analysis of typical phenophases of major crops under climate change in the three provinces of Northeast China[J]. Scientia Agricultura Sinica, 2011, 44(20): 4180−4189
[46] 马玉平, 王培娟, 王达, 等. 作物发育模式重构及基于甘蔗的模拟检验[J]. 应用气象学报, 2021, 32(5): 603−617 doi: 10.11898/1001-7313.20210508 MA Y P, WANG P J, WANG D, et al. Reconstruction of crop development model with its simulation test based on sugarcane[J]. Journal of Applied Meteorological Science, 2021, 32(5): 603−617 doi: 10.11898/1001-7313.20210508
[47] LOBELL D B, SIBLEY A, IVAN ORTIZ-MONASTERIO J. Extreme heat effects on wheat senescence in India[J]. Nature Climate Change, 2012, 2(3): 186−189 doi: 10.1038/nclimate1356
[48] ZHANG J H, YI Q F, XING F W, et al. Rapid shifts of peak flowering phenology in 12 species under the effects of extreme climate events in Macao[J]. Scientific Reports, 2018, 8(1): 13950 doi: 10.1038/s41598-018-32209-4
[49] PORTER J R, GAWITH M. Temperatures and the growth and development of wheat: a review[J]. European Journal of Agronomy, 1999, 10(1): 23−36 doi: 10.1016/S1161-0301(98)00047-1
[50] HE D, WANG E L, WANG J, et al. Data requirement for effective calibration of process-based crop models[J]. Agricultural and Forest Meteorology, 2017, 234/235: 136−148 doi: 10.1016/j.agrformet.2016.12.015


计量
- 文章访问数: 597
- HTML全文浏览量: 243
- PDF下载量: 92
