
Growth and nutrient uptake rates of duckweed cultivated on anaerobically digested dairy manure
-
Abstract: Nutrient cycling from flushed dairy manure systems to croplands is a national research priority for sustainable dairy operations, resource utilization, and environmental protection. Cultivating aquatic plants on dairy wastewaters has been considered an effective approach for wastewater treatment/reuse and nutrient recycling. This study aimed to investigate nutrient uptake and biomass production of duckweed strains on dairy wastewater. Three duckweed strains, namely Landoltia punctata 0128, Lemna gibba 7589, and Lemna minuta 9517, were cultivated on anaerobically digested (AD) dairy manure wastewater over a period of 28 days. The highest reduction rate of total nitrogen (TN) was achieved by L. punctata from the AD dairy manure with a dilution ratio of 1:18 (83.1 mg·L-1 TN) at 11.6% (±1.64%). The highest reduction rate of total phosphorus (TP) was achieved by L. punctata from the AD dairy manure with a dilution ratio of 1:27 (6.7 mg·L-1 TP) at 15.4% (±4.4%). The corresponding fresh weight-based growth rate constants of L. punctata were 0.11 g·d-1 and 0.17 g·d-1 for the dilution ratios of 1:18 and 1:27, respectively. It has been shown that, among the three duckweed strains tested in this study, L. punctata has the greatest potential to be cultivated on the medium of diluted AD dairy manure for best N and P reduction and biomass production.摘要: 养分从牛粪到农田的循环利用是养牛场可持续发展、资源利用和环境保护的重点研究内容。利用奶牛场废水种植水生植物被认为是一种有效的废水处理及养分循环的方法。本文研究了3种浮萍[少根紫萍0128(Landoltia punctata 0128)、膨胀浮萍7589(Lemna gibba 7589)和小浮萍9517(Lemna minuta 9517)]在厌氧发酵过的奶牛场废水中种植时的养分吸收和生物质变化。在28 d的测试期间,种植在稀释比例为1:18的厌氧发酵过的牛奶场废水中的少根紫萍01283获得最高的总氮吸收率(11.6%±1.6%),种植在稀释比例为1:27厌氧发酵过的牛奶场废水中的少根紫萍0128获得最高的总磷吸收率(15.4%±4.4%);相应地少根紫萍鲜重的增长率分别为0.11 g·d-1和0.17 g·d-1。3种浮萍中,少根紫萍最具有吸收牛奶场废水氮、磷并获得较高生物质的潜力。
-
As of 2018, Idaho was the fourth-largest producer of milk in the United States with 490 dairy farms and about 600 000 cows producing over 14.6 billion pounds of milk (USDA, 2018). About 59% of the Idaho dairies are in the Magic Valley Region of Southern Idaho (IDA, 2018) which generate large volumes of wastewater stored in lagoon systems (Chen et al., 2014). The dairy wastewater contains large quantities of nitrogen (N) and phosphorus (P) which risk being transferred into the environment via run-off from over-irrigation and ammonia volatilization (Adhikari et al., 2015; Zhao et al., 2014). Concerns of the environmental impacts caused by concentrated animal productions have resulted in reporting requirements, mandatory management plans, and other regulations (Chen et al., 2014; Leytem et al., 2013; IDEQ, 2018). Identifying potential nutrient management technologies that utilize N and P contained in flushed dairy manure is essential to the sustainability of the Idaho dairy industry.
Duckweed is a family of tiny, flowering plants which belong to the Lemnaceae family and adapt to a variety of weather environments worldwide. There are five different genera including Lemna, Spirodela, Wolfia, Wolffiella and Landoltia with 37 different species (Cheng and Stomp, 2009; Ziegler et al., 2015). Many species grow in various locations throughout the world and form distinct populations called strains. Each duckweed strain has a specific set of nutrient and growth characteristics under a range of environmental conditions. Duckweed has been studied as a means of domestic and agricultural wastewater treatment in the past 30 years (Mohedano et al., 2012). The interest in duckweed has stemmed from its ability to 1) double its biomass weight in as little as 2 to 3 days under ideal conditions, 2) uptake N and P from nutrient rich sources, and 3) be harvested and stocked without many challenges (Rusoff et al., 1980; Sooknah et al., 2004; Adhikari et al., 2015).
Previous studies have utilized duckweed for the removal of nutrients from swine and cattle wastewaters in large-scale applications such as constructed wetlands, wastewater stabilization lagoons, and storage ponds (Al-Nozaily, 2001; Mohedano et al., 2012; Adhikari et al., 2015). These studies have shown that the cultivation of duckweed is a promising technology to recycle nutrients from wastewaters. However, there are few studies on N and P uptaking from anaerobically digested (AD) dairy manure by duckweed cultivation. To address nutrient management challenges, the aim of this study was to investigate the nutrient recovery and biomass production through duckweed cultivation on AD dairy manure for waste management and resource utilization in a value-added manner, resulting in a sustainable dairy industry in Idaho. The specific objectives of this study were to 1) investigate the feasibility of cultivating duckweed on AD Idaho dairy manure, 2) identify the achievable N and P reduction rates by cultivation of the selected duckweed stains, and 3) determine the duckweed biomass growth rate constants for further research of scale-up cultivation.
1. Materials and methods
1.1 Pre-culturing duckweed strains
Three duckweed strains, i.e., Landoltia punctata 0128 (L. punctata), Lemna gibba 7589 (L. gibba), and Lemna minuta 9517 (L. minuta), were obtained from the Rutgers Duckweed Stock Cooperative and aseptically pre-cultured in 114 mm × 86 mm × 102 mm cultivation containers on 200 mg∙L-1 of Hoagland's No. 2 Basal Salt Mixture for seven days (Zhao et al., 2014). The Hoagland's No. 2 Basal Salt Mixture (hereafter named as Hoagland E-Medium) contains 115.03 mg∙L-1 of ammonium phosphate monobasic (NH4H2PO4), 2.86 mg∙L-1 of boric acid (H3BO3), 656.40 mg∙L-1 of calcium nitrate tetrahydrate [Ca(NO3)2∙4H2O], 0.08 mg∙L-1 of cupric sulfate pentahydrate (CuSO4∙5H2O), 5.32 mg∙L-1 of ferric tartrate (C12Fe2H12O8), 240.76 mg∙L-1 of magnesium sulfate anhydrous (MgSO4), 1.81 mg∙L-1 of manganese chloride tetrahydrate (MnCl2∙4H2O), 0.02 mg∙L-1 molybdenum trioxide (MoO3), 606.6 mg∙L-1 of potassium nitrate (KNO3), and 0.22 mg∙L-1 of zinc nitrate hexahydrate [Zn(NO3)2∙6H2O]. Once a double-layer of duckweed growth was observed, the duckweed strains were transferred to larger rectangular PET cultivation containers (0.267 m2) for 30 days to allow for further growth as inoculum samples for testing.
1.2 Batch testing
1.2.1 Nutrient analysis
AD dairy manure was collected from an anaerobic digester operated on a local dairy in Southern Idaho. Chemical oxygen demand (COD), total nitrogen (TN), total Kjeldahl nitrogen (TKN), nitrates and nitrites (NO3-N+NO2-N), ammonia nitrogen (NH3-N), ortho-phosphate-phosphorus (o-PO4-P), total phosphorus (TP), and suspended solids (SS) of the collected AD manure were analyzed using a spectrophotometer (DR5000, Hach, USA) based on Method 8000, Method 10242, Method 10031, Method 10214, Method 10127, and Method 8006, respectively (Hatch Company, 2005). Total and volatile solids of the collected AD manure were analyzed by the standard methods of APHA (2015). Analyses of pH, dissolved oxygen (DO) and electric conductivity (EC) were conducted using the Sper Scientific 850049 water meter kit (Scottsdale, AZ). Table 1 summarizes the nutrient characteristics of the AD dairy manure used in this study.
Table 1. Characteristics of anaerobically digested dairy manure testedParameter Mean ± S.D. Total nitrogen (mg∙L-1) 1 600.4±245.1 Total Kjeldahl nitrogen (mg∙L-1) 1 500.3±243.2 NO3-N+NO2-N (mg∙L-1) 100.1±3.2 NH3-N (mg∙L-1) 505.0±16.5 Total phosphorus (mg∙L-1) 188.0±4.0 Ortho-phosphate-phosphorus P (mg∙L-1) 108.8±27.4 Chemical oxygen demand (mg∙L-1) 7 679±81 Total solids (%) 1.2±0.0 Volatile solids (%) 53.9±2.3 Suspended solids (mg∙L-1) 11 714±1 283 pH 7.97±0.15 Electric conductivity (mS∙cm-1) 12.6±0.1 Dissolved oxygen (mg∙L-1) 2.6±0.4 1.2.2 Growth media preparation
Growth media were prepared to establish the desired nutrient concentrations by mixing AD dairy manure and deionized water. These corresponded to TN concentrations of 114, 84 and 57 mg∙L-1, respectively, and the initial pH values of the media were 8.11±0.03, 8.12±0.04, and 8.19±0.02, respectively, for the media with the dilution ratios of 1:13, 1:18 and 1:27.
The pH of the media was then adjusted to 6.7 every 2 days with 5% (v/v) acetic acid to keep an ideal growth environment and reduce the loss of ammonia nitrogen (NH3-N) from the cultivation containers. After the pH of the media was adjusted to 6.7±0.01, the initial EC, DO and temperature of the media were measured at 1 660±12 µS∙cm-1, 4.7±0.1 mg∙L-1, and 21.4±0.1 ℃ at the dilution ratio of 1:13, 1 331±16 µS∙cm-1, 3.8±0.2 mg∙L-1, and 23.4±0.1 ℃ at the dilution ratio of 1:18, and 1 066±10 µS∙cm-1, 4.5±0.1 mg∙L-1, and 23.6±0.1 ℃ at the dilution ratio of 1:27, respectively. The media were then transferred to cultivation containers with transparent lids to prevent evapotranspiration. The cultivation containers have dimensions of 114 mm × 86 mm × 102 mm, a surface area of 0.011 6 m2, and a total volume of 300 mL. An average of 0.46, 0.57 and 0.61 g of L. punctata, L. gibba, and L. minuta were added to the cultivation containers to cover 25% of the surface area of each container.
1.2.3 Experimental setup
Batch tests were conducted inside an environmental chamber (Environmental Growth Chambers, Chagrin Falls, Ohio) at an average light intensity of 10 000 lux and a photoperiod of 16:8 (light:dark). The experiments consisted of a total 36 cultivation containers having a working volume of 200 mL in each container. Of the 36 cultivation containers, the three duckweed strains, i.e., L. punctata, L. gibba, and L. minuta, were applied in triplicates to 27 cultivation containers containing the media as described above. Nine control cultivation containers (without duckweed inoculation) consisted of the same media with three dilution ratios (1:13, 1:18 and 1:27) in triplicates.
2. Sampling and analysis
Liquid medium samples were extracted from each of the cultivation containers with the duckweed treatments and the control for nutrient analysis on day 0, 4, 8, 12, 16, 20, 24, and 28, and measured for temperature, TN, TKN, NO3-N+NO2-N, NH3-N TP, o-PO4-P, pH, DO, and EC based on the methods mentioned previously. The duckweed samples were carefully filtered from the cultivation containers and separated from the medium using course tulle. Residual liquid on duckweed surfaces was blotted with absorbent paper and fresh weight of duckweed was measured with an analytical balance (Mettler AE 260 Delta Range). After weighting, the duckweed biomass samples were carefully re-inoculated back to their containers immediately.
The rate constant of the fresh weight-based growth (hereafter named growth rate constant, g∙d-1) and its standard deviation were established using a linear regression equation (Eq.1) (Cheng et al., 2009; Xu et al., 2010).
$$ {C_t} = k \cdot t + {C_{\rm{o}}} $$ (1) where Co is the initial duckweed fresh weight (g), Ct (g) is the duckweed fresh weight (g) at time t (days), and k is the duckweed growth rate constant (g∙d-1).
The initial and final nutrient concentrations of the media were used to find the percent TN and TP reduction rates (Sooknah et al., 2004; Adhikari et al., 2015). The differences in TN and TP reduction rates between the media with the duckweed (treatments) and without the duckweed (control) were used to calculate the percentages of TN and TP uptake rates by the duckweed strains.
The fresh weights of duckweed biomass samples and the nutrient concentrations in the media were analyzed statistically using a two-way analysis of variance (ANOVA) to determine the validity of the experimental results between the treatments and controls by the statistical software of SPSS (SPSS Inc., Chicago, IL, USA). Tukey simultaneous tests were conducted to determine the statistical differences between treatments.
3. Results and discussion
3.1 Nitrogen and phosphorus uptake by duckweed
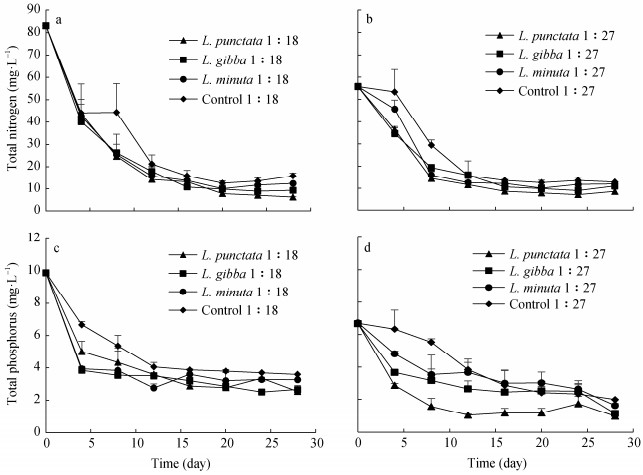
Total nitrogen (TN) and total phosphorus (TP) concentrations within the media for the 28-day cultivation period are shown in Figure 1. The growth media was modelled to maintain conditions that would apply to the cultivation environment of a dairy lagoon where bacteria, algae, and duckweed would thrive symbiotically among the batch samples. The three duckweed strains grew well on the cultivation media from diluted AD dairy manure with the dilution ratios of 1:18 (84 mg∙L-1 of TN) and 1:27 (57 mg∙L-1 of TN). However, the three duckweed strains perished after 4 days of cultivation on the dilution ratio of 1:13 (114 mg∙L-1 of TN) which indicated that the nutrient concentration in the medium with the dilution ratio of 1:13 was too high for the duckweed strains. In the media with dilution ratios of 1:18 and 1:27 AD dairy manure, TN and TP were removed quickly in the first 12 days of cultivation, and the concentrations of TN and TP slowly decreased in the next 16 days of cultivation. This is in some disagreement with the study by Xu et al. (2010) in which the greatest ammonium nitrogen (NH4-N) recovery occurred in the first 20 days of cultivation. Therefore, it is important to identify the period of fast nutrient reduction rates which in turn helps determine the timing and types of nutrients that need to be replenished to keep a healthy duckweed production system.
![]() Figure 1. Total nitrogen (TN) and total phosphorus (TP) concentrations in diluted anaerobically digested dairy manure with the dilution ratios of 1:18 and 1:27 treated with L. punctata, L. gibba and L. minuta
Figure 1. Total nitrogen (TN) and total phosphorus (TP) concentrations in diluted anaerobically digested dairy manure with the dilution ratios of 1:18 and 1:27 treated with L. punctata, L. gibba and L. minutaThe changes of nutrient concentrations along with the reduction rates of TN and TP in the cultivation media are shown in Table 2. The highest TN reduction rate of 92.5%±0.3% was observed from the media with the dilution ratio of 1:18 treated by L. punctata. Generally, TP reductions of 66.0%±0.6% to 85.6%±4.4% were achieved, and the highest TP reduction rate of 85.6%±4.4% came from the media with the dilution ratio of 1:27 treated by L. punctata, which are in agreement with the previously reported N and P reduction ranges of 60%-98% from pretreated livestock wastewaters (Adhikari et al., 2015; Mohedano et al., 2012; Xu et al., 2010). In addition to the uptake by duckweed, reduction in N and P in the batch experiments could occur due to other means such as ammonia volatilization, nitrification/denitrification, bacterial transformation, sedimentation and algal uptake (Mohedano et al., 2012; Xu et al., 2010). The controls in this study were used to explore the possibility of N and P reduction via these alternative pathways to determine the uptake by the duckweed strains.
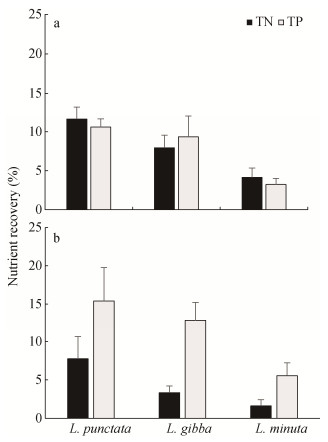
Table 2. Total nitrogen (TN) and total phosphorus (TP) reductions in diluted anaerobically digested dairy manure with the dilution ratios of 1:18 and 1:27 treated with L. punctata, L. gibba and L. minuta at the end of the 28-day testTreatment Dilution ratio TN TP Initial (mg∙L-1) Final (mg∙L-1) Reduction (%) Initial (mg∙L-1) Final (mg∙L-1) Reduction (%) L. punctata 1:18 83.1±1.4 6.3±0.2 92.5±0.3 9.9±0.0 2.5±0.1 74.4±1.3 L. gibba 83.1±1.4 9.3±0.1 88.8±0.3 9.9±0.0 2.7±0.2 73.1±2.5 L. minuta 83.1±1.4 12.5±0.3 85.0±1.5 9.9±0.0 3.3±0.0 66.0±0.6 Control 83.1±1.4 15.9±1.3 80.9±0.2 9.9±0.0 3.6±0.0 63.8±0.3 L. punctata 1:27 55.8±1.4 8.6±1.4 84.7±2.3 6.7±0.0 1.0±0.3 85.6±4.4 L. gibba 55.8±1.4 11.0±0.6 80.2±1.5 6.7±0.1 1.4±0.6 83.0±2.3 L. minuta 55.8±1.4 12.0±0.3 78.5±0.4 6.7±0.0 1.6±0.1 75.7±1.7 Control 55.8±1.4 12.9±0.1 76.9±0.8 6.7±0.0 2.3±0.6 70.2±0.0 Data in the table are mean ± S.D. (the standard deviation of triplicate samples). Figure 2 shows the results of TN and TP uptake by the duckweed strains from the cultivation media after a 28-day batch growth. These results were determined by the difference between the N and P reductions from the batch system (Table 2) of the duckweed treatments and the controls. At the dilution ratio of 1:18, the duckweed achieved TN and TP reduction rates of 11.6%±1.6% and 10.6%±1.1% for L. punctata, 7.9%±1.6% and 9.3%±2.7% for L. gibba, and 4.1%±1.2% and 3.2%±0.8% for L. minuta. At the dilution ratio of 1:27, reduction rates of 7.8%±2.9% of TN and 15.4%±4.4% of TP, 3.3%±0.9% of TN and 12.9%±2.4% of TP, and 1.6%±0.8% of TN and 5.6%±1.7% of TP for L. punctata, L. gibba, and L. minuta, respectively, were observed. In our batch systems, the combined alternative pathways (i.e., ammonia volatilization, nitrification/denitrification, bacterial transformation, sedimentation and algal uptake) contributed to a N reduction in the range of 65.0% to 80.8% in the growth media with the dilution ratio of 1:18 and 53.8% to 61.6% in the growth media with the dilution ratio 1:27. The main pathways for P reduction are bacterial transformations, biomass absorption either by duckweed or algae, and sedimentation. Mohedano et al. (2012) reported that P was most strongly reduced in the anaerobic stage of a lagoon system probably due to sedimentation. An anaerobic zone could have formed at the bottom of the cultivation containers where anaerobic bacteria can assimilate P. The P reduction caused by bacterial transformations, algae biomass adsorption, and sedimentation contributed to an average of 64% and 69% among the duckweed treatments in the growth media with the dilution ratio of 1:18 and 1:27, respectively.
![]() Figure 2. Percent recovery of total nitrogen (TN) and total phosphorus (TP) by the duckweed strains from the anaerobically digested dairy manure with (a) the dilution ratio of 1:18, (b) the dilution ratio of 1:27. Percent recoveries of TN and TP among the three duckweed strains were statistically significant at P ≤ 0.05.
Figure 2. Percent recovery of total nitrogen (TN) and total phosphorus (TP) by the duckweed strains from the anaerobically digested dairy manure with (a) the dilution ratio of 1:18, (b) the dilution ratio of 1:27. Percent recoveries of TN and TP among the three duckweed strains were statistically significant at P ≤ 0.05.3.2 Duckweed growth rate
It was observed that the first eight days of cultivation were most productive with L. punctata and L. gibba covering over three quarters of the surface area. L. minuta did not double its biomass in the first eight days of cultivation and covered less than half of the surface area. Throughout the entire cultivation period of 28-days for both the dilution ratios of 1:18 and 1:27, L. punctata and L. minuta maintained a healthy complexion on the surface of the AD dairy manure and the Hoagland E-medium. However, at day 16 the fronds on the first layer of L. gibba started turning white but maintained buoyancy to float on the surface of the PET containers until day 28 for the dilution ratio of 1:18. A double layer of L. punctata and L. gibba formed at the surface of the dilution ratio of 1:27 by the 28th day. Filamentous algae growth was visible on the surface of the controls as well as on the sides of the cultivation containers. Algae growth was not visible on the surface of the duckweed treatments but was visible on the sides of the containers by the end of the cultivation period.
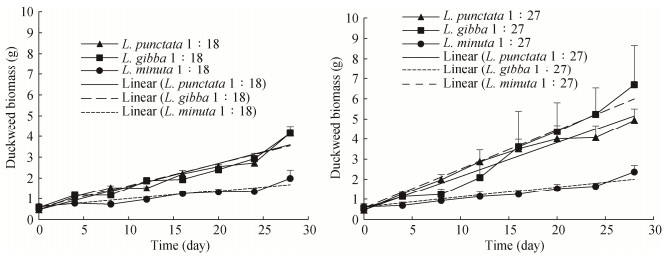
The growth of duckweed biomass was quantitatively analyzed by the growth rate constants which were calculated from the measured fresh weights of duckweed biomass samples cultivated with the dilution ratios of 1:18 and 1:27 through a linear model (Tables 3 and 4). As shown in Figure 3, no lag phases were observed due to the pre-culturing of the duckweed strains on the Hoagland E-Medium. The zero-order regressions fit the experimental data well with R2 values in the range of 0.79 and 0.97. Growth rate constants of the three duckweed strains were higher at the dilution ratio of 1:27 with the growth rate constants of 0.17±0.02, 0.19±0.06 and 0.04±0.00 g∙d-1 (10.0, 8.0, 1.6 mg∙d-1 dry weight) for L. punctata, L. gibba, and L. minuta, respectively. In this study, the differences between the growth rate constants of L. punctata and L. gibba at the dilution ratios of 1:18 and 1:27 were significant (P ≤ 0.05) different from that of L. minuta.
Table 3. Linear equations describing relationships between the duckweed biomass fresh weight and cultivation time. The regression equations were found to significantly fit a linear model (P ≤ 0.05).Treatment Dilution ratio of AD manure Regression equation R2 L. punctata 1:18 y=0.11x+0.47 0.89 L. gibba y=0.11x+0.57 0.87 L. minuta y=0.04x+0.62 0.79 L. punctata 1:27 y=0.17x+0.47 0.95 L. gibba y=0.19x+0.57 0.86 L. minuta y=0.03x+0.62 0.83 Table 4. Growth rate constants of L. punctata, L. gibba, and L. minuta cultivated on the anaerobically digested dairy manure with the dilution ratios of 1:18 and 1:27. The growth rate constants of both L. punctate and L. gibba were significantly higher (P ≤ 0.05) than that of L. minuta for both the dilution ratios of 1:18 and 1:27.Treatment Dilution ratio
of AD manureGrowth rate
constant (g∙d-1)L. punctata 1:18 0.11±0.00 L. gibba 0.11±0.01 L. minuta 0.04±001 L. punctata 1:27 0.17±0.02 L. gibba 0.19±0.07 L. minuta 0.03±0.00 Data of growth rate constants in the table are mean ± S.D. (the standard deviation of triplicate samples). ![]() Figure 3. Fresh biomass of L. punctata, L. gibba, and L. minuta cultivated on the anaerobically digested dairy manure with the dilution ratios of 1:18 and 1:27. The growth rate constants of both L. punctata and L. gibba were significantly higher than that of L. minuta for both the dilution ratios of 1:18 and 1:27 (P ≤ 0.05).
Figure 3. Fresh biomass of L. punctata, L. gibba, and L. minuta cultivated on the anaerobically digested dairy manure with the dilution ratios of 1:18 and 1:27. The growth rate constants of both L. punctata and L. gibba were significantly higher than that of L. minuta for both the dilution ratios of 1:18 and 1:27 (P ≤ 0.05).In a study conducted by Toyama et al. (2018), the growth rate constants for duckweed strains of L. punctata and L. gibba were approximately determined as 30 and 4.5 mg∙d-1, respectively, when cultivated on AD domestic wastewater at 30.1 mg∙L-1 of NH4-N and 3.3 mg∙L-1 of nitrate nitrogen (NO3-N). It is possible that the higher nitrogen concentrations in this study inhibited growth of the duckweed strains as compared to the values reported by Toyama et al. (2018).
Further research should include the verification of the N and P contents in the duckweed biomass and an analysis of the mechanisms of N and P assimilation by bacteria, algae, and duckweed strains when cultivated on flushed AD dairy manure. These factors will potentially maximize biomass production and nutrient reduction such that the cultivation of duckweed on dairy farms could be utilized as a protein supplement for dairy cattle.
4. Conclusions
The results obtained from this study have shown that L. punctata, L. gibba and L. minuta could be cultivated on diluted AD dairy manure for nutrient recovery and biomass production. On average, the TN and TP reduction rates were 11.6% and 10.6% for L. punctata, 7.9% and 9.3% for L. gibba, and 4.1% and 3.2% for L. minuta from the AD dairy manure with the dilution ratio of 1:18. The TN and TP reduction rates with the dilution ratio of 1:27 were 7.8% and 15.4% for L. punctata, 3.3% and 12.9% for L. gibba, and 1.6% and 5.6% for L. minuta. It is concluded that the duckweed strains recovered approximately the same percentages of TN and TP from the AD dairy manure at the dilution ratio of 1:18. The duckweed strains had a higher TP recovery than TN recovery when cultivated on the AD dairy manure with the dilution ratio of 1:27. At the dilution ratios of 1:18 and 1:27 the growth rate constants were 0.11 g∙d-1 and 0.17 g∙d-1 for L. punctata, 0.11 g∙d-1 and 0.19 g∙d-1 for L. gibba, and 0.04 g∙d-1 and 0.03 g∙d-1 for L. minuta. Both L. punctata and L. gibba had significantly higher growth rate constants when compared to L. minuta. It has been shown that, among the three duckweed strains tested in this study, L. punctata has the greatest potential to be cultivated on the medium of diluted AD dairy manure for the best N and P reduction and biomass production.
Acknowledgements: This research was financially supported in partial by the USDA NIFA, USDA Multi-State Hatch Projects and the Idaho Agricultural Experiment Station. -
![]()
Figure 1. Total nitrogen (TN) and total phosphorus (TP) concentrations in diluted anaerobically digested dairy manure with the dilution ratios of 1:18 and 1:27 treated with L. punctata, L. gibba and L. minuta
![]()
Figure 2. Percent recovery of total nitrogen (TN) and total phosphorus (TP) by the duckweed strains from the anaerobically digested dairy manure with (a) the dilution ratio of 1:18, (b) the dilution ratio of 1:27. Percent recoveries of TN and TP among the three duckweed strains were statistically significant at P ≤ 0.05.
![]()
Figure 3. Fresh biomass of L. punctata, L. gibba, and L. minuta cultivated on the anaerobically digested dairy manure with the dilution ratios of 1:18 and 1:27. The growth rate constants of both L. punctata and L. gibba were significantly higher than that of L. minuta for both the dilution ratios of 1:18 and 1:27 (P ≤ 0.05).
Table 1 Characteristics of anaerobically digested dairy manure tested
Parameter Mean ± S.D. Total nitrogen (mg∙L-1) 1 600.4±245.1 Total Kjeldahl nitrogen (mg∙L-1) 1 500.3±243.2 NO3-N+NO2-N (mg∙L-1) 100.1±3.2 NH3-N (mg∙L-1) 505.0±16.5 Total phosphorus (mg∙L-1) 188.0±4.0 Ortho-phosphate-phosphorus P (mg∙L-1) 108.8±27.4 Chemical oxygen demand (mg∙L-1) 7 679±81 Total solids (%) 1.2±0.0 Volatile solids (%) 53.9±2.3 Suspended solids (mg∙L-1) 11 714±1 283 pH 7.97±0.15 Electric conductivity (mS∙cm-1) 12.6±0.1 Dissolved oxygen (mg∙L-1) 2.6±0.4  下载: 导出CSV
Table 2 Total nitrogen (TN) and total phosphorus (TP) reductions in diluted anaerobically digested dairy manure with the dilution ratios of 1:18 and 1:27 treated with L. punctata, L. gibba and L. minuta at the end of the 28-day test
Treatment Dilution ratio TN TP Initial (mg∙L-1) Final (mg∙L-1) Reduction (%) Initial (mg∙L-1) Final (mg∙L-1) Reduction (%) L. punctata 1:18 83.1±1.4 6.3±0.2 92.5±0.3 9.9±0.0 2.5±0.1 74.4±1.3 L. gibba 83.1±1.4 9.3±0.1 88.8±0.3 9.9±0.0 2.7±0.2 73.1±2.5 L. minuta 83.1±1.4 12.5±0.3 85.0±1.5 9.9±0.0 3.3±0.0 66.0±0.6 Control 83.1±1.4 15.9±1.3 80.9±0.2 9.9±0.0 3.6±0.0 63.8±0.3 L. punctata 1:27 55.8±1.4 8.6±1.4 84.7±2.3 6.7±0.0 1.0±0.3 85.6±4.4 L. gibba 55.8±1.4 11.0±0.6 80.2±1.5 6.7±0.1 1.4±0.6 83.0±2.3 L. minuta 55.8±1.4 12.0±0.3 78.5±0.4 6.7±0.0 1.6±0.1 75.7±1.7 Control 55.8±1.4 12.9±0.1 76.9±0.8 6.7±0.0 2.3±0.6 70.2±0.0 Data in the table are mean ± S.D. (the standard deviation of triplicate samples).
下载: 导出CSV
Table 3 Linear equations describing relationships between the duckweed biomass fresh weight and cultivation time. The regression equations were found to significantly fit a linear model (P ≤ 0.05).
Treatment Dilution ratio of AD manure Regression equation R2 L. punctata 1:18 y=0.11x+0.47 0.89 L. gibba y=0.11x+0.57 0.87 L. minuta y=0.04x+0.62 0.79 L. punctata 1:27 y=0.17x+0.47 0.95 L. gibba y=0.19x+0.57 0.86 L. minuta y=0.03x+0.62 0.83
下载: 导出CSV
Table 4 Growth rate constants of L. punctata, L. gibba, and L. minuta cultivated on the anaerobically digested dairy manure with the dilution ratios of 1:18 and 1:27. The growth rate constants of both L. punctate and L. gibba were significantly higher (P ≤ 0.05) than that of L. minuta for both the dilution ratios of 1:18 and 1:27.
Treatment Dilution ratio
of AD manureGrowth rate
constant (g∙d-1)L. punctata 1:18 0.11±0.00 L. gibba 0.11±0.01 L. minuta 0.04±001 L. punctata 1:27 0.17±0.02 L. gibba 0.19±0.07 L. minuta 0.03±0.00 Data of growth rate constants in the table are mean ± S.D. (the standard deviation of triplicate samples).
下载: 导出CSV
-
ADHIKARI U, HARRIGAN T, REINHOLD D M. 2015. Use of duckweed-based constructed wetlands for nutrient recovery and pollutant reduction from dairy wastewater[J]. Ecological Engineering, 78:6-14 doi: 10.1016/j.ecoleng.2014.05.024
AL-NOZAILY F. 2001. Performance and Process Analysis of Duckweed-Covered Sewage Lagoons for High Strength Sewage:The Case of Sana'a, Yemen[M]. Rotterdam:Balkema
APHA. 2015. Standard Methods for the Examination of Water and Wastewater[M]. 21st ed. Washington, DC:American Public Health Association
CHEN L D, GRAY C W, NEIBLING H, et al. 2014. On-farm comparison of two dairy manure application methods in terms of ammonia and odor emissions and costs[J]. Applied Engineering in Agriculture, 30(5):805-813 http://www.wanfangdata.com.cn/details/detail.do?_type=perio&id=04cd4ad4dc504f8a015e1a8c7fa3536b
CHENG J J, STOMP A M. 2009. Growing duckweed to recover nutrients from wastewaters and for production of fuel ethanol and animal feed[J]. Clean-Soil Air Water, 37(1):17-26 doi: 10.1002/clen.200800210
CHENG J Y, BERGMANN B A, CLASSEN J J, et al. 2002. Nutrient recovery from swine lagoon water by Spirodela punctata[J]. Bioresource Technology, 81(1):81-85 doi: 10.1016/S0960-8524(01)00098-0
Hach Company. 2005. DR5000 Spectrophotometer: Procedures Manual[R]. Germany: Hatch Company
IDA. 2018. Dairy's economic impact[EB/OL].[2019-03-12]. https://www.idahodairymens.org/economic-impact/
IDEQ. 2018, Concentrated Animal Feeding Operations[M/OL].[2019-03-12]. http://www.deq.idaho.gov/water-quality/wastewater/cafos/
LEYTEM A B, DUNGAN R S, BJORNEBERG D L, et al. 2013. Greenhouse gas and ammonia emissions from an open-freestall dairy in southern idaho[J]. Journal of Environmental Quality, 42(1):10-20 http://www.wanfangdata.com.cn/details/detail.do?_type=perio&id=d29bb7c42adf03c9ce061530ee39ee33
MOHEDANO R A, COSTA R H R, TAVARES F A, et al. 2012. High nutrient removal rate from swine wastes and protein biomass production by full-scale duckweed ponds[J]. Bioresource Technology, 112:98-104 doi: 10.1016/j.biortech.2012.02.083
RUSOFF L L, BLAKENEY E W, CULLEY D D. 1980. Duckweeds (Lemnaceae family):A potential source of protein and amino acids[J]. Journal of Agricultural and Food Chemistry, 28(4):848-850 http://d.old.wanfangdata.com.cn/NSTLQK/NSTL_QKJJ0210026660/
SOOKNAH R D, WILKIE A C. 2004. Nutrient removal by floating aquatic macrophytes cultured in anaerobically digested flushed dairy manure wastewater[J]. Ecological Engineering, 22(1):27-42 http://www.wanfangdata.com.cn/details/detail.do?_type=perio&id=62a23e43f5b25e5c889f0fd320b02eea
TOYAMA T, HANAOKA T, TANAKA Y, et al. 2018. Comprehensive evaluation of nitrogen removal rate and biomass, ethanol, and methane production yields by combination of four major duckweeds and three types of wastewater effluent[J]. Bioresource Technology, 250:464-473 doi: 10.1016/j.biortech.2017.11.054
USDA, NASS. 2018 State agriculture overview[EB/OL].[2019-03-12]. https://www.nass.usda.gov/Quick_Stats/Ag_Overview/stateOverview.php?state=IDAHO
XU J L, CHENG J J, STOMP A M. 2010. Growing spirodela polyrrhiza in swine wastewater for the production of animal feed and fuel ethanol:A pilot study[J]. Clean-Soil Air Water, 40(7):760-765 http://cn.bing.com/academic/profile?id=815a70c7db3469c8e85c7668218ac89f&encoded=0&v=paper_preview&mkt=zh-cn
ZHAO Z, SHI H J, LIU Y, et al. The influence of duckweed species diversity on biomass productivity and nutrient removal efficiency in swine wastewater[J]. Bioresource Technology, 2014, 167:383-389 doi: 10.1016/j.biortech.2014.06.031
ZIEGLER P, ADELMANN K, ZIMMER S, et al. Relative in vitro growth rates of duckweeds (Lemnaceae)-The most rapidly growing higher plants[J]. Plant Biology, 2015, 17(S1):33-41
-
期刊类型引用(2)
1. 赵轶鹏,赵新勇,胡婷婷,罗景升,王云霞. 浮萍人工培养和调控及其在稻田生态系统中的作用. 中国农学通报. 2024(22): 72-80 .  百度学术
百度学术
2. 邱静芸,雷小文,欧翔,陈荣强,郭礼荣,钟云平,李建军,黄滟茹,李建明. 不同基肥处理对赣南稀土尾矿种植皇竹草的农艺性状及产量的影响. 江西科学. 2021(03): 421-425 . 百度学术
其他类型引用(0)
计量
- 文章访问数: 656
- HTML全文浏览量: 100
- PDF下载量: 887
- 被引次数: 2
